Units
For currency based metrics (Revenue, Delivery value, etc.), the currency is defined in the global settings and applies company wide to all locations. For count based metrics (Sales No., Order amount, etc.), the unit is the same as in the source system. For example:- If the item is sold in pieces and
Sales No. = 12.0then 12 pieces were sold. - If the item is sold in kg and
Sales No. = 3.2then 3.2 kg were sold.
Transactional vs. Aggregated Sales Data
There are two ways we can process sales data:- Daily Aggregated: Summary of your daily totals per item and location
- Transactional: Detailed data for every single sale including time, items and locations
Sales Metrics
All metrics related to sales coming either from the POS or the ERP. Sales metrics can be grouped & filtered byLocation, Location-Tag,Item, Item Groups, Item-Tag, Time (down to hourly level for transactional data, otherwise daily).
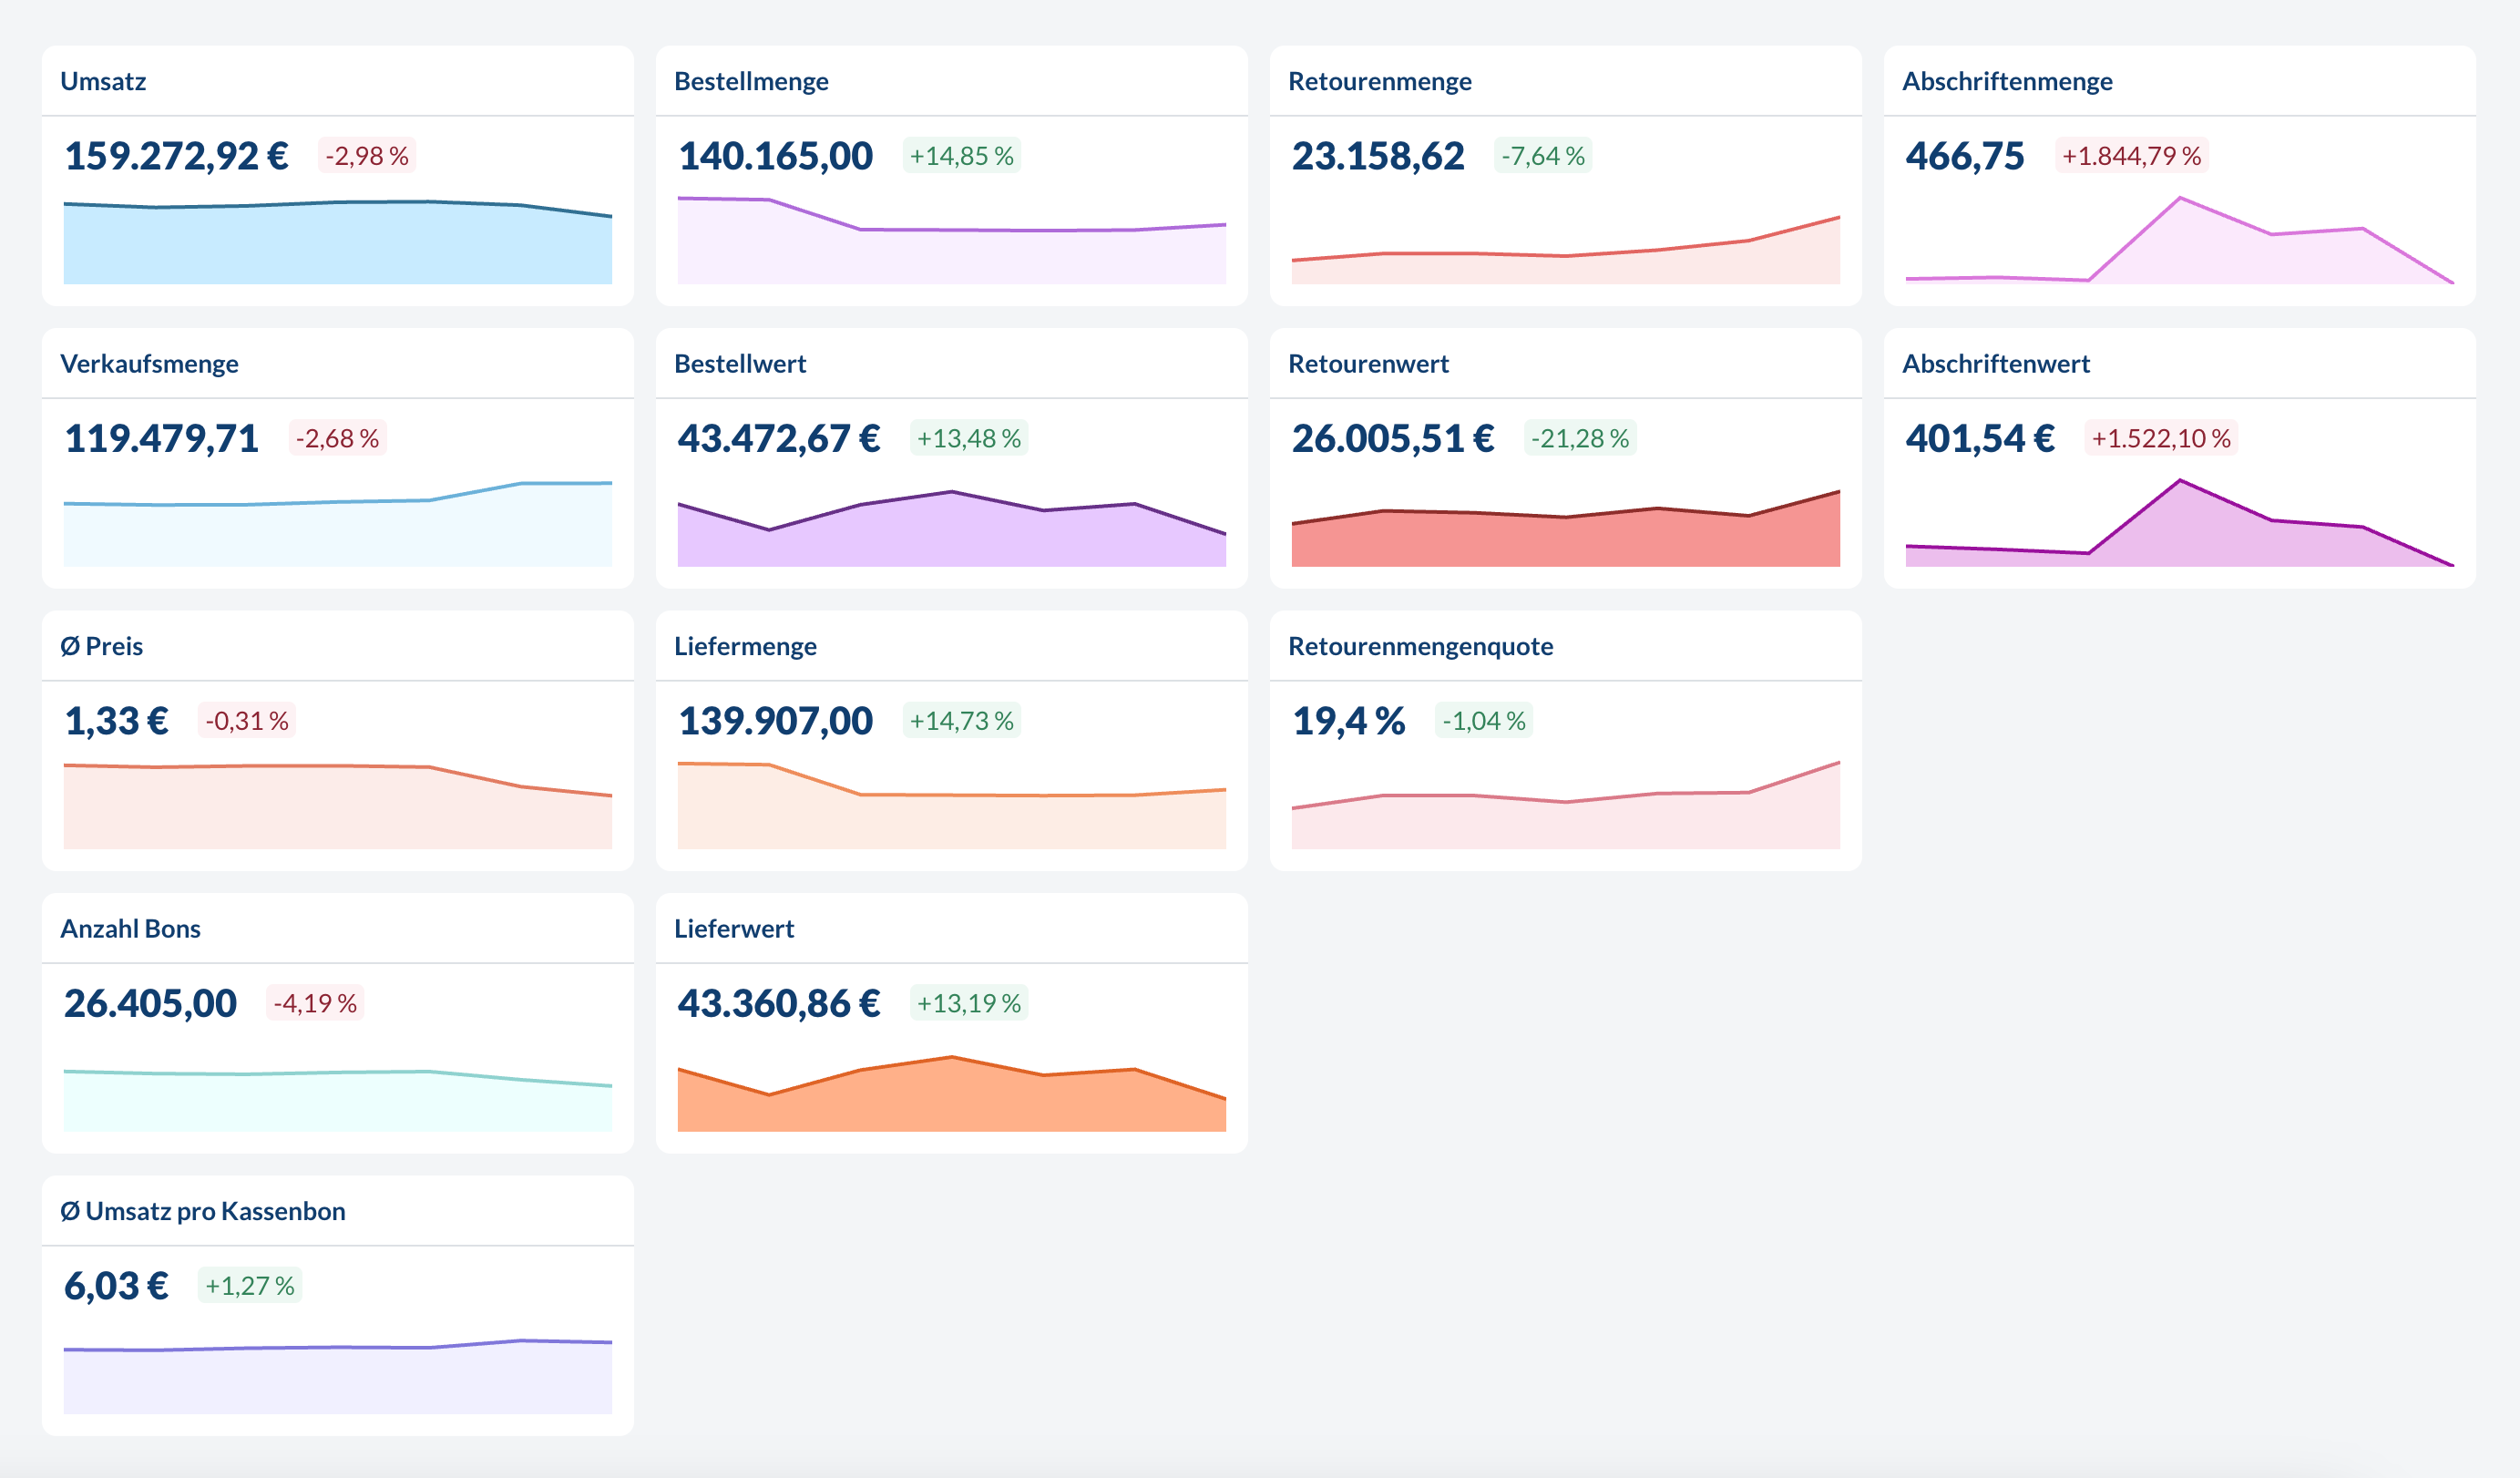
Revenue
Revenue
The total gross revenue generated from sales.
Sales No.
Sales No.
The total number of items sold.
Ø Price
Ø Price
The average price per item sold.
Transaction count
Transaction count
The total number of transactions processed.When filtering or grouping by
Item, Item Groups or Item-Tag this metric will only reflect the number of transactions which included the respective items.This metric is only available with transactional data.
Ø Revenue per transaction
Ø Revenue per transaction
The average revenue generated per customer transaction.When filtering or grouping by
Item, Item Groups or Item-Tag this metric will only reflect the average revenue per transaction of transactions which included the respective items.This metric is only available with transactional data.
Order Metrics
All metrics related to orders and deliveries. Order metrics can be grouped & filtered byLocation, Location-Tag, Item, Item Groups, Item-Tag, Time (daily level only).
Order amount
Order amount
The total quantity of items ordered.
Order value
Order value
The total value of all ordered items.
Delivery amount
Delivery amount
The total quantity of items that were delivered to customers.
Delivery value
Delivery value
The monetary value of all delivered items.
Order proposal
Order proposal
The suggested order quantity based on our prediction algorithms.
This metric is only available when using the order automation feature.
Requested value
Requested value
The monetary value of all proposed amounts from our prediction algorithm.
This metric is only available when using the order automation feature.
Returns and Depreciation Metrics
All metrics related to returns, write-offs and depreciation. Returns and depreciation metrics can be grouped & filtered byLocation, Location-Tag, Item, Item Groups, Item-Tag, Time (daily level only).
Depreciated amount
Depreciated amount
The quantity of items that were marked as depreciated or written off.
Depreciated value
Depreciated value
The monetary value of all depreciated items.
Return amount
Return amount
The quantity of items that were returned.
Return value
Return value
The monetary value of all returned items.
Return amount rate
Return amount rate
Depending on the configuration this is the percentage of items that were returned relative to
- total delivered items or
- the total sold items.
Return value rate
Return value rate
This is the
return amount rate weighted by the value of the items.✨ AI Metrics
Our AI algorithms provide valuable insights into your business by analyzing sales patterns, returns data, and other factors. These metrics can help you identify trends, optimize inventory, and make data-driven decisions.Lost Revenue Potential due to Stock Outs
By analyzing out of stock data and hourly sales patterns we can estimate the potential sales that could have been made if there hadn’t been a stockout. Revenue potential based metrics can be grouped & filtered byLocation, Location-Tag, Item, Item Groups, Item-Tag, Time (down to hourly level for transactional data, otherwise daily).
Availability
Availability
Shows the percentage of items that were available until the closing of the store. In other words this is the inverse of the stock out rate. This is a daily not hourly metric.
Sales Potential
Sales Potential
The estimated number of total items that could have been sold (based on historical hourly purchase patterns) if a stock out hadn’t occured.If an item doesn’t have a long enough history the AI relies more on average sales patterns than item specific sales patterns.
This metric is only available with transactional data.
Revenue Potential
Revenue Potential
The estimated total revenue that could have been generated (based on historical hourly purchase patterns) if a stock out hadn’t occured.If an item doesn’t have a long enough history the AI relies more on average sales patterns than item specific sales patterns.
This metric is only available with transactional data.
Lost Sales Potential
Lost Sales Potential
The number of potential sales that were missed due to stock outs. In principle this is simply
Sales Potential - Sales No..This metric is only available with transactional data.
Lost Revenue Potential
Lost Revenue Potential
The monetary value of missed sales opportunities, calculated from lost sales potential and average prices. In principle this is simply
Revenue Potential - Revenue.This metric is only available with transactional data.
Deep Dive: Lost Revenue Potential
Net Flow Analysis
By analyzing the net flow of items we can detect if stores are systematically overstocked or if there are unexplained outflows of inventory occuring. Net flow metrics can be grouped & filtered byLocation, Location-Tag, Item, Item Groups, Item-Tag, Time (daily level only).
Net flow
Net flow
The difference between incoming and outgoing quantities per delivered item.Interpreting net flow:
- If every delivered amount is typically leaving the store again in some explained way (sales, returns, etc.) then the net flow is typically 0.
- If the net flow is systematically more than 0 it means there is more inflow than outflow. Reasons for this could be that there are recipes missing that connect ordered to sold items, or that items leave the store in an undocumented way.
- If the net flow is systematically less than 0 it means there is more outflow than inflow. Reasons for this could be that recipes are faulty or not followed in the store.
Net flow in %
Net flow in %
The percentage representation of the net flow relative to total delivered quantities.