Net flow metric to identify potential issues with recipes, inventory management, or even fraud.
Understanding Net Flow
Net flow measures the difference between the inflow (items delivered) and outflow (items sold, returned and depreciated) of your stores. This analysis requires tracking:- Delivered Items: Both raw materials and finished products
- Outgoing Items: Sales, returns, and depreciation
- Recipe Conversions: How raw materials convert to final products
Why Net Flow Analysis is Complex
Traditionally, tracking inventory flows requires extensive manual effort and deep operational knowledge. Key challenges include:- Recipe Conversions: Raw materials transform into multiple products (e.g., 1kg coffee beans → many cups of coffee)
- Multi-Step Processing: Items may go through several stages before final sale (e.g., frozen → thawed → baked)
- Timing Differences: Deliveries and sales happen at different times, often spanning multiple days
Estimating Net Flow
Here’s how we calculate theNet flow metric:
Calculate Inflow
For each order we calculate the inflow as the
Delivered amount.We are not including starting inventory levels in this logic, but when evaluating
Net flow over longer time periods this does not present an issue as the impact of starting and ending inventory becomes negligible.Calculate Outflows
Until the next order arrives, track:
Sales No.Return amountDepreciation amount
The tracking period for the outflows starts with an order and ends when the next order arrives. This ensures we capture all movements related to a specific delivery.
Example: Coffee Bean Net Flow
Let’s see how this works for coffee beans:-
Inflow
- On December 4th, store receives 1 bag (1kg) of coffee beans
- Inflow = 1 bag
-
Outflows (until next delivery)
- 50 small coffees (12g × 50 = 600g = 0.6 bags)
- 10 large coffees (20g × 10 = 200g = 0.2 bags)
- Total outflows = 0.8 bags
-
Net Flow
Understanding Net Flow Results
TheNet flow metric helps identify three key scenarios:
- Balanced Flow (≈ 0%): Items are being used as expected
- Positive Flow (> 0%): More items enter than leave, suggesting:
- Recipe quantities aren’t being followed
- Outflow of items isnt’t being properly tracked (missing returns or depreciations)
- Potential fraud in sales recording (e.g. large coffee is handed out but small coffee booked in the POS)
- Negative Flow (< 0%): More items leave than enter, indicating:
- Recipe quantities may be too generous
- Deliveries aren’t being recorded
Net flow is calculated for each order instead of each day, it can sometimes look weird when visualized over a timeseries if there were some zero orders.
For example if an item is orderable every day and has a shelf live of a week, it is conceivable that it is only ordered once per week and sold on all the other days.
In this example when looking at the net flow for the week everything looks in order but looking at it on a daily basis shows a positive net flow for the day with the order and negative net flow on the other days where the orders where 0 but there were outflows.
Common Use Cases
Recipe Compliance
Net flow helps identify if stores follow recipes correctly. For example:- If a recipe requires 100g of coffee per cup
- But staff consistently uses 90g
- You’ll see a positive net flow for coffee beans
Fraud Detection
Net flow can reveal potential fraud patterns. For example:- Staff books a small coffee but serves a large one
- Keeps the price difference
- Results in unexpectedly positive net flow for coffee beans
Analyzing Net Flow
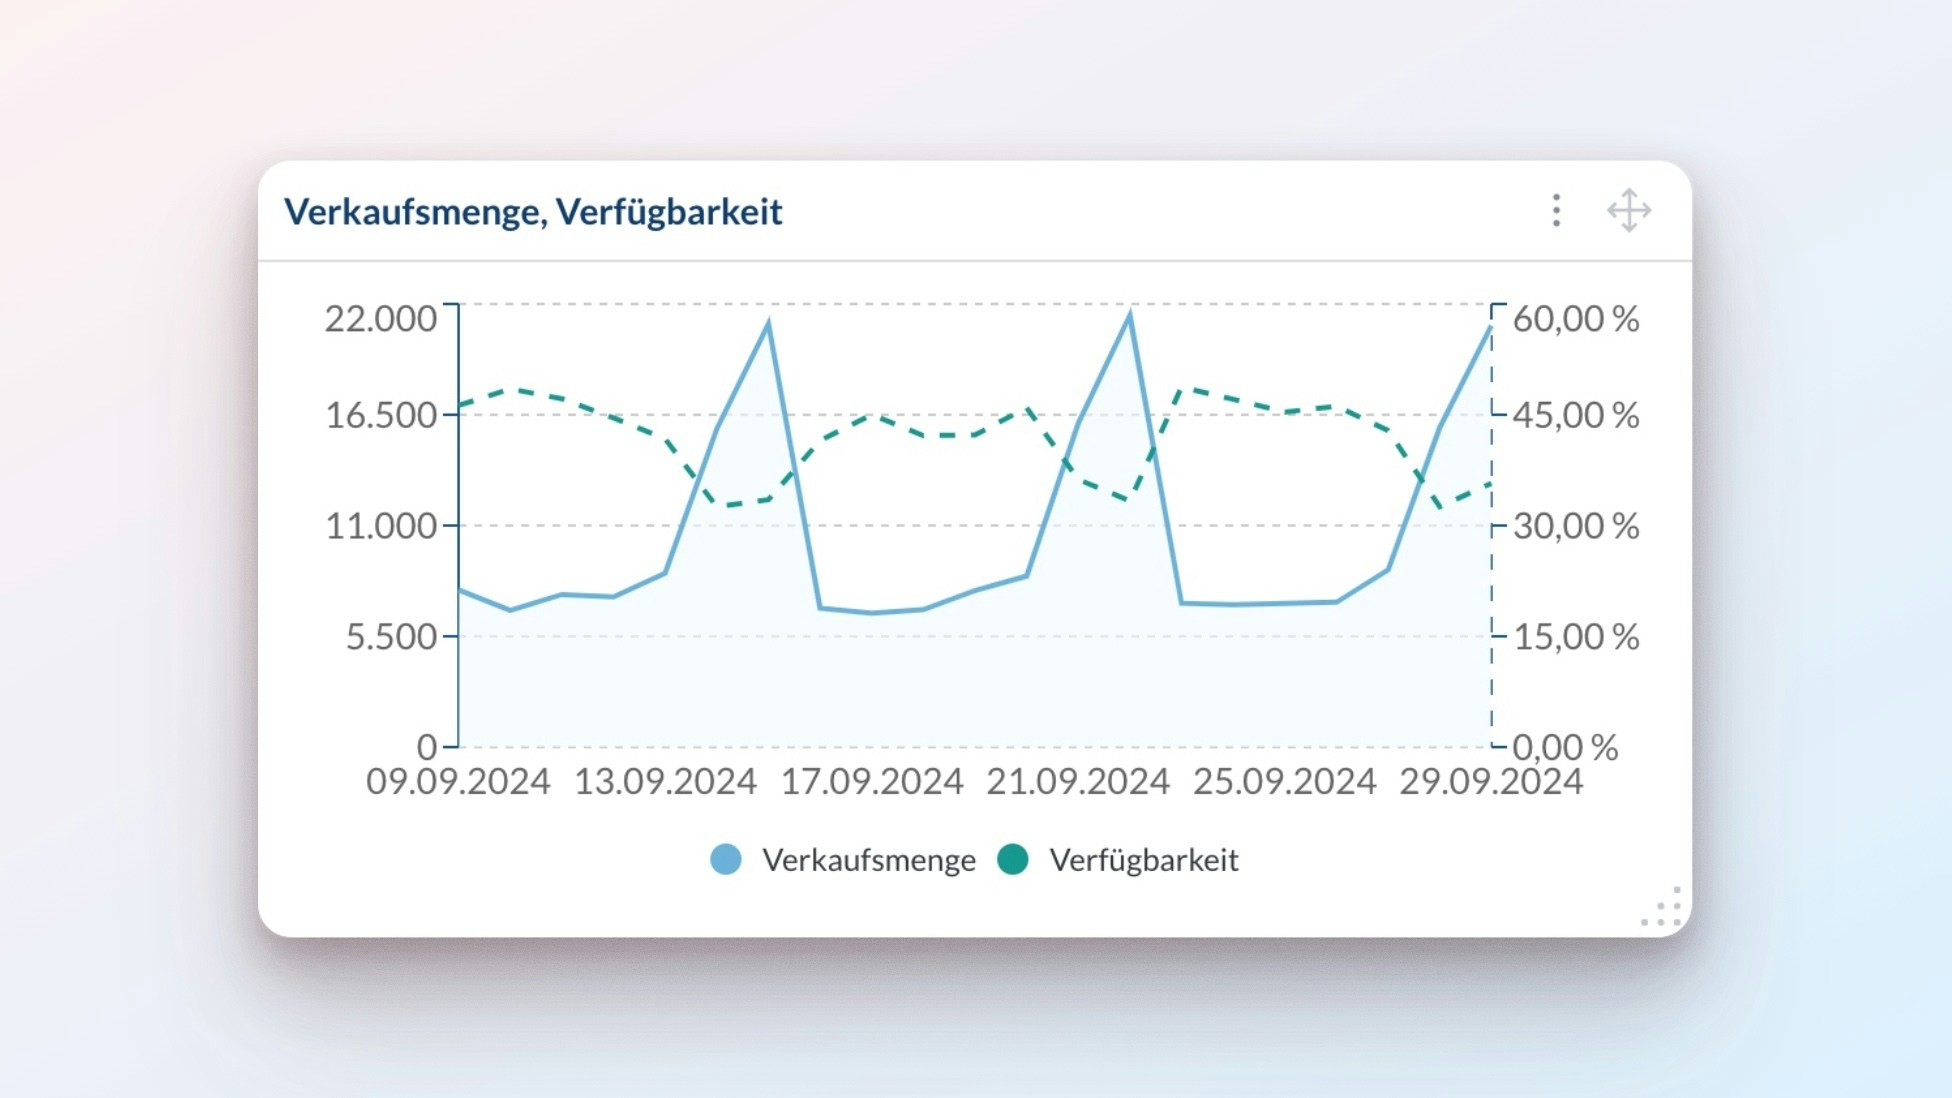
The true value of net flow analysis comes from comparing patterns across locations and time periods. Here’s an example comparing net flow for coffee beans across different stores: