Lost revenue potential metric to identify missed sales opportunities.
By the end, you’ll understand how to automatically detect stock-outs and measure their business impact, replacing time-consuming manual analysis with data-driven insights.
Why Stock-Out Analysis is Hard
Traditionally, analyzing stock-out impacts requires significant manual effort and business expertise. Key factors that affect the impact include:- Time of Day: Breakfast items stocking out before lunch or pastries before 15:00 can have a high impact.
- Location Type: High-traffic locations (e.g., train stations) are more sensitive to late stock-outs than low-traffic locations that receive low traffic in the evening.
- Product Substitution: Stock-Out impact may be minimal if similar products are available (e.g., “Laugenstangen” substituting “Laugensemmel”)
Lost revenue potential metric automates this process for faster insights.
Estimating Stock-Outs
The first step to automatically estimating theLost revenue potential is to automatically detect stock-outs. We determine stock-outs through the Return amount: Products with returns are considered available until closing.
This information is also exposed on the BI with the Availability metric where 100% Availability means the item was never stocked out, 0% Availability means the item was always stocked out.
Note that this method has the following limitations:
- It does not work for multi day items which could have been available but did not have to be returned.
- It does not work for items which are not typically getting returned (e.g. water, coffee)
Estimating the Sales Potential
To estimate theSales potential, our AI analyzes typical sales patterns throughout the day. For each item and location we look at:
- How much of an item usually sells after specific times
- Different patterns for weekdays and holidays
- For new items we prime our model with the average sales profile for the location as a whole so we can provide reliable estimates right from the start.
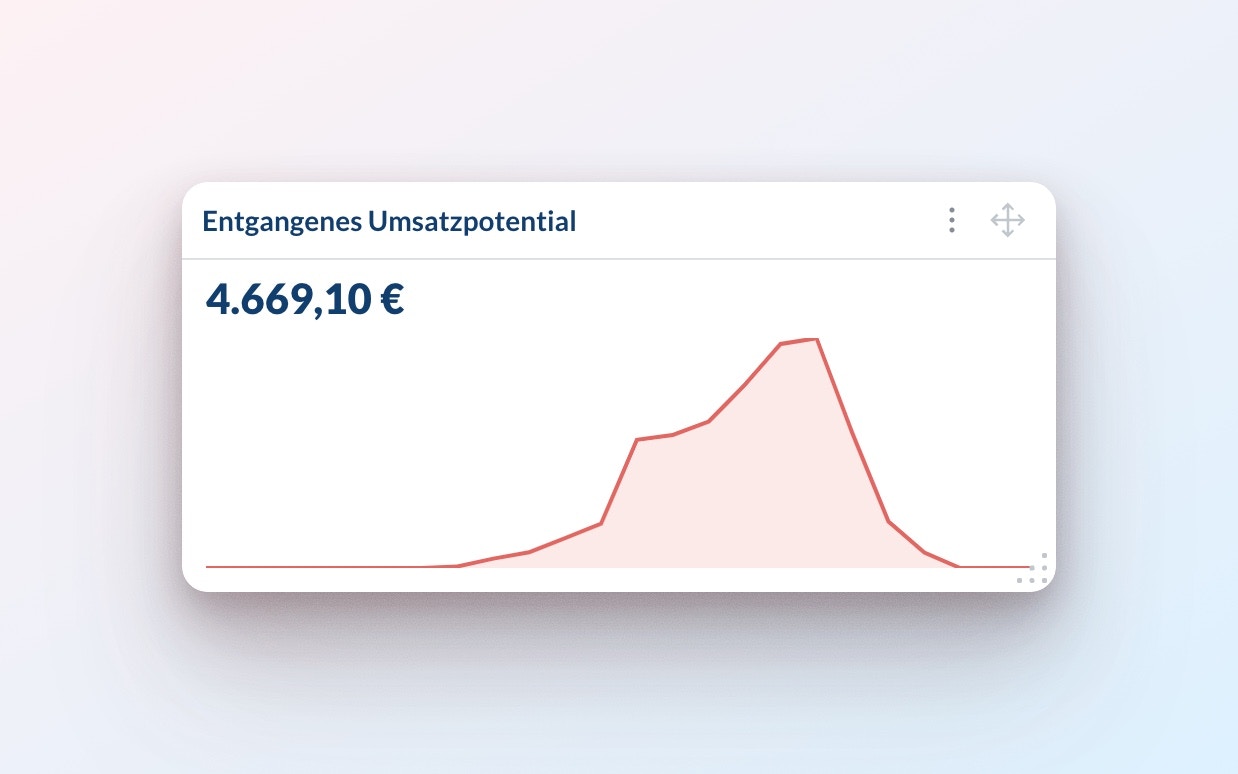
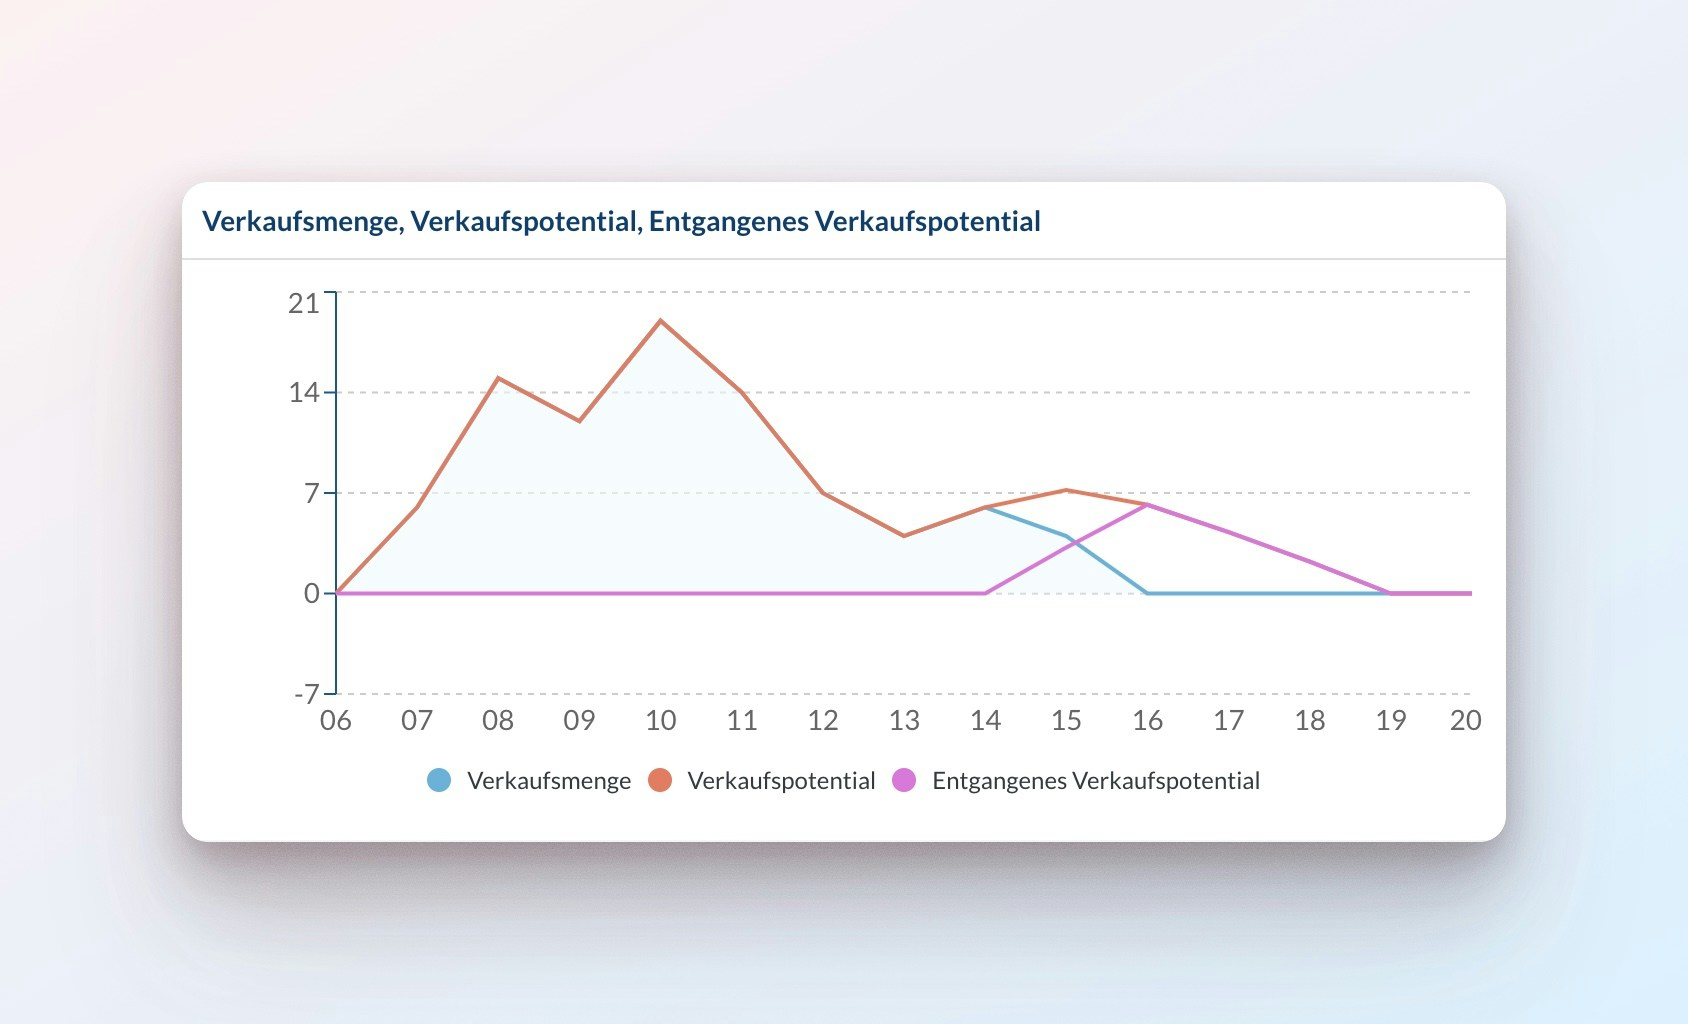
Lost Sales Potential simply is the difference between the Sales Potential and Sales No. that actually occured before the stock-out.
Here’s an example where an item stocked out at 15:30. The Sales No. drops to zero, while the Sales Potential shows what we would expect based on typical sales patterns:
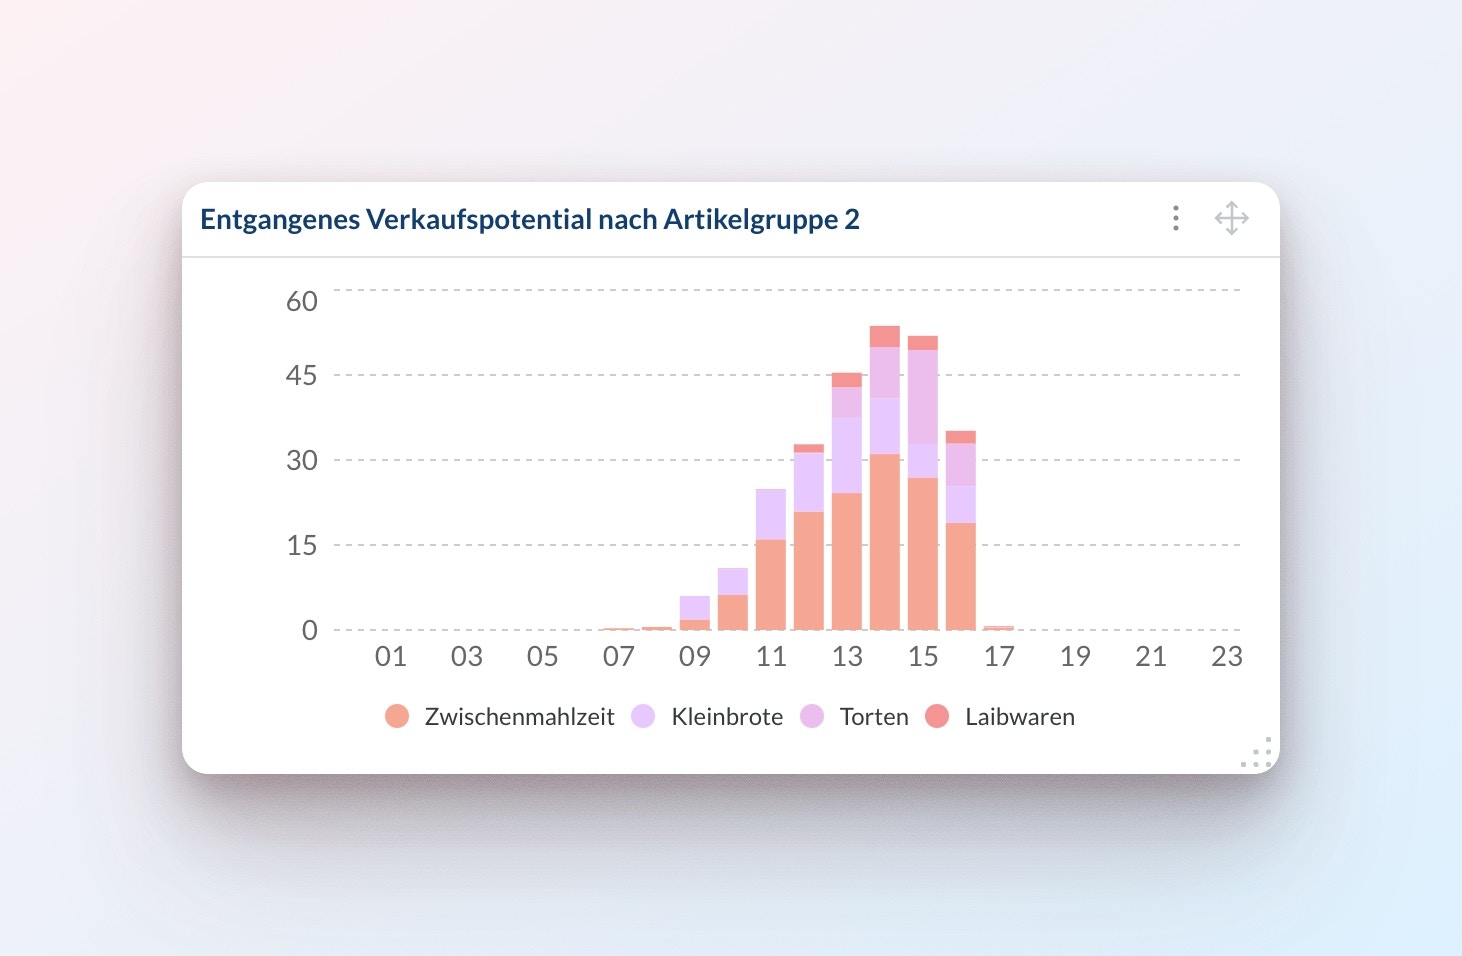
Analyzing Lost Sales Potential
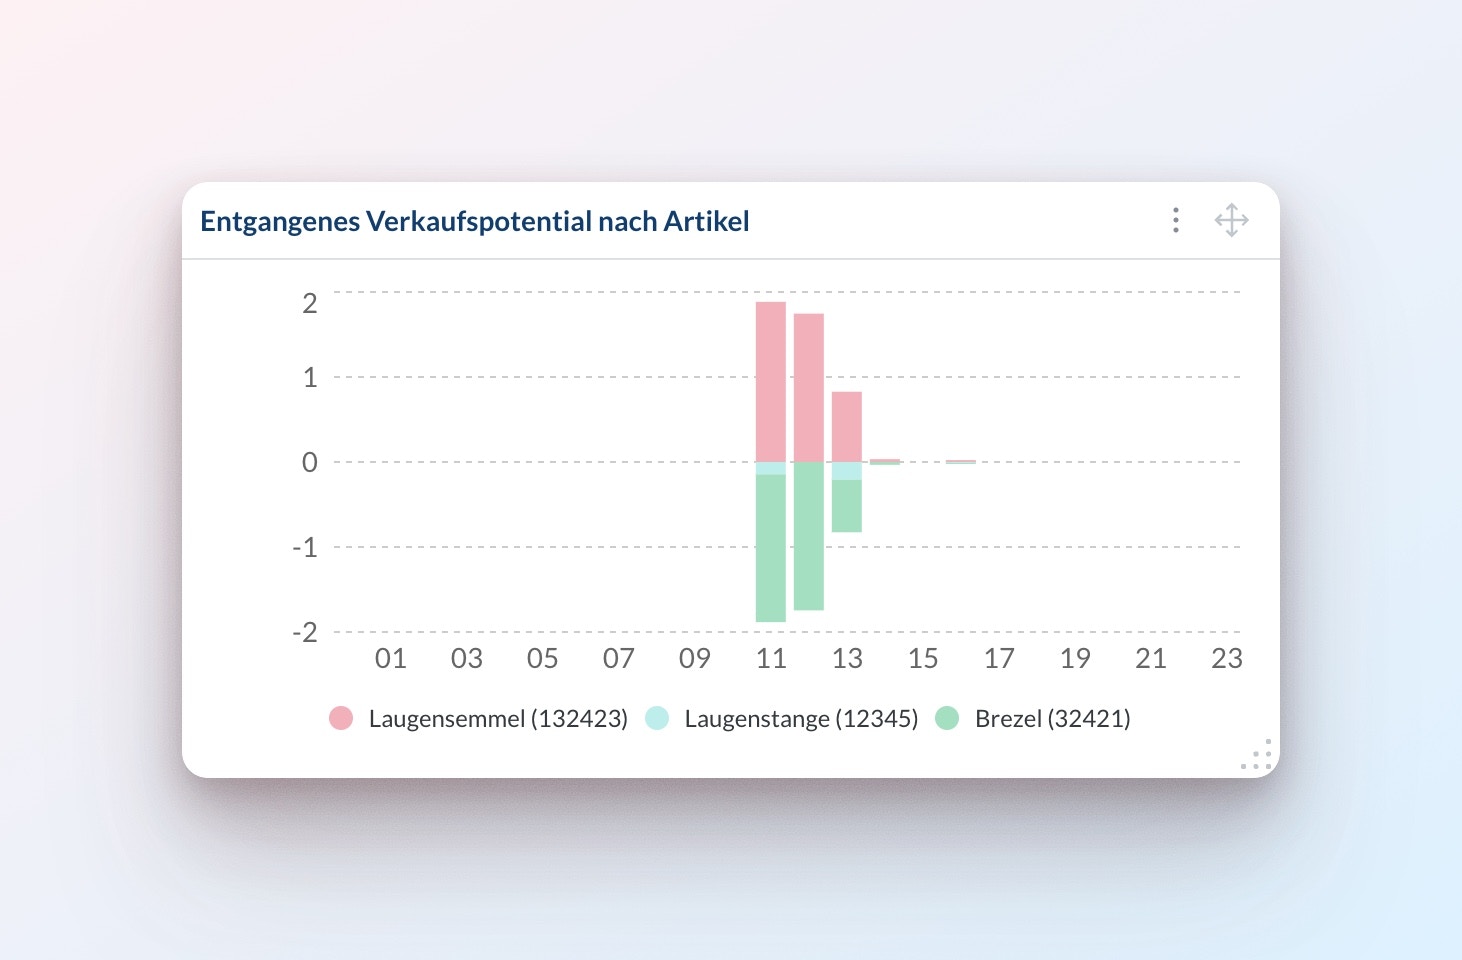
Looking at a single location, item and day makes it clear to understand how we estimate theLost Sales Potential. However, the true value from this metric comes from the fact that it can be aggregated however you like. Here is an example of a stacked bar chart where the Lost sales potential got grouped by the item group across the day:
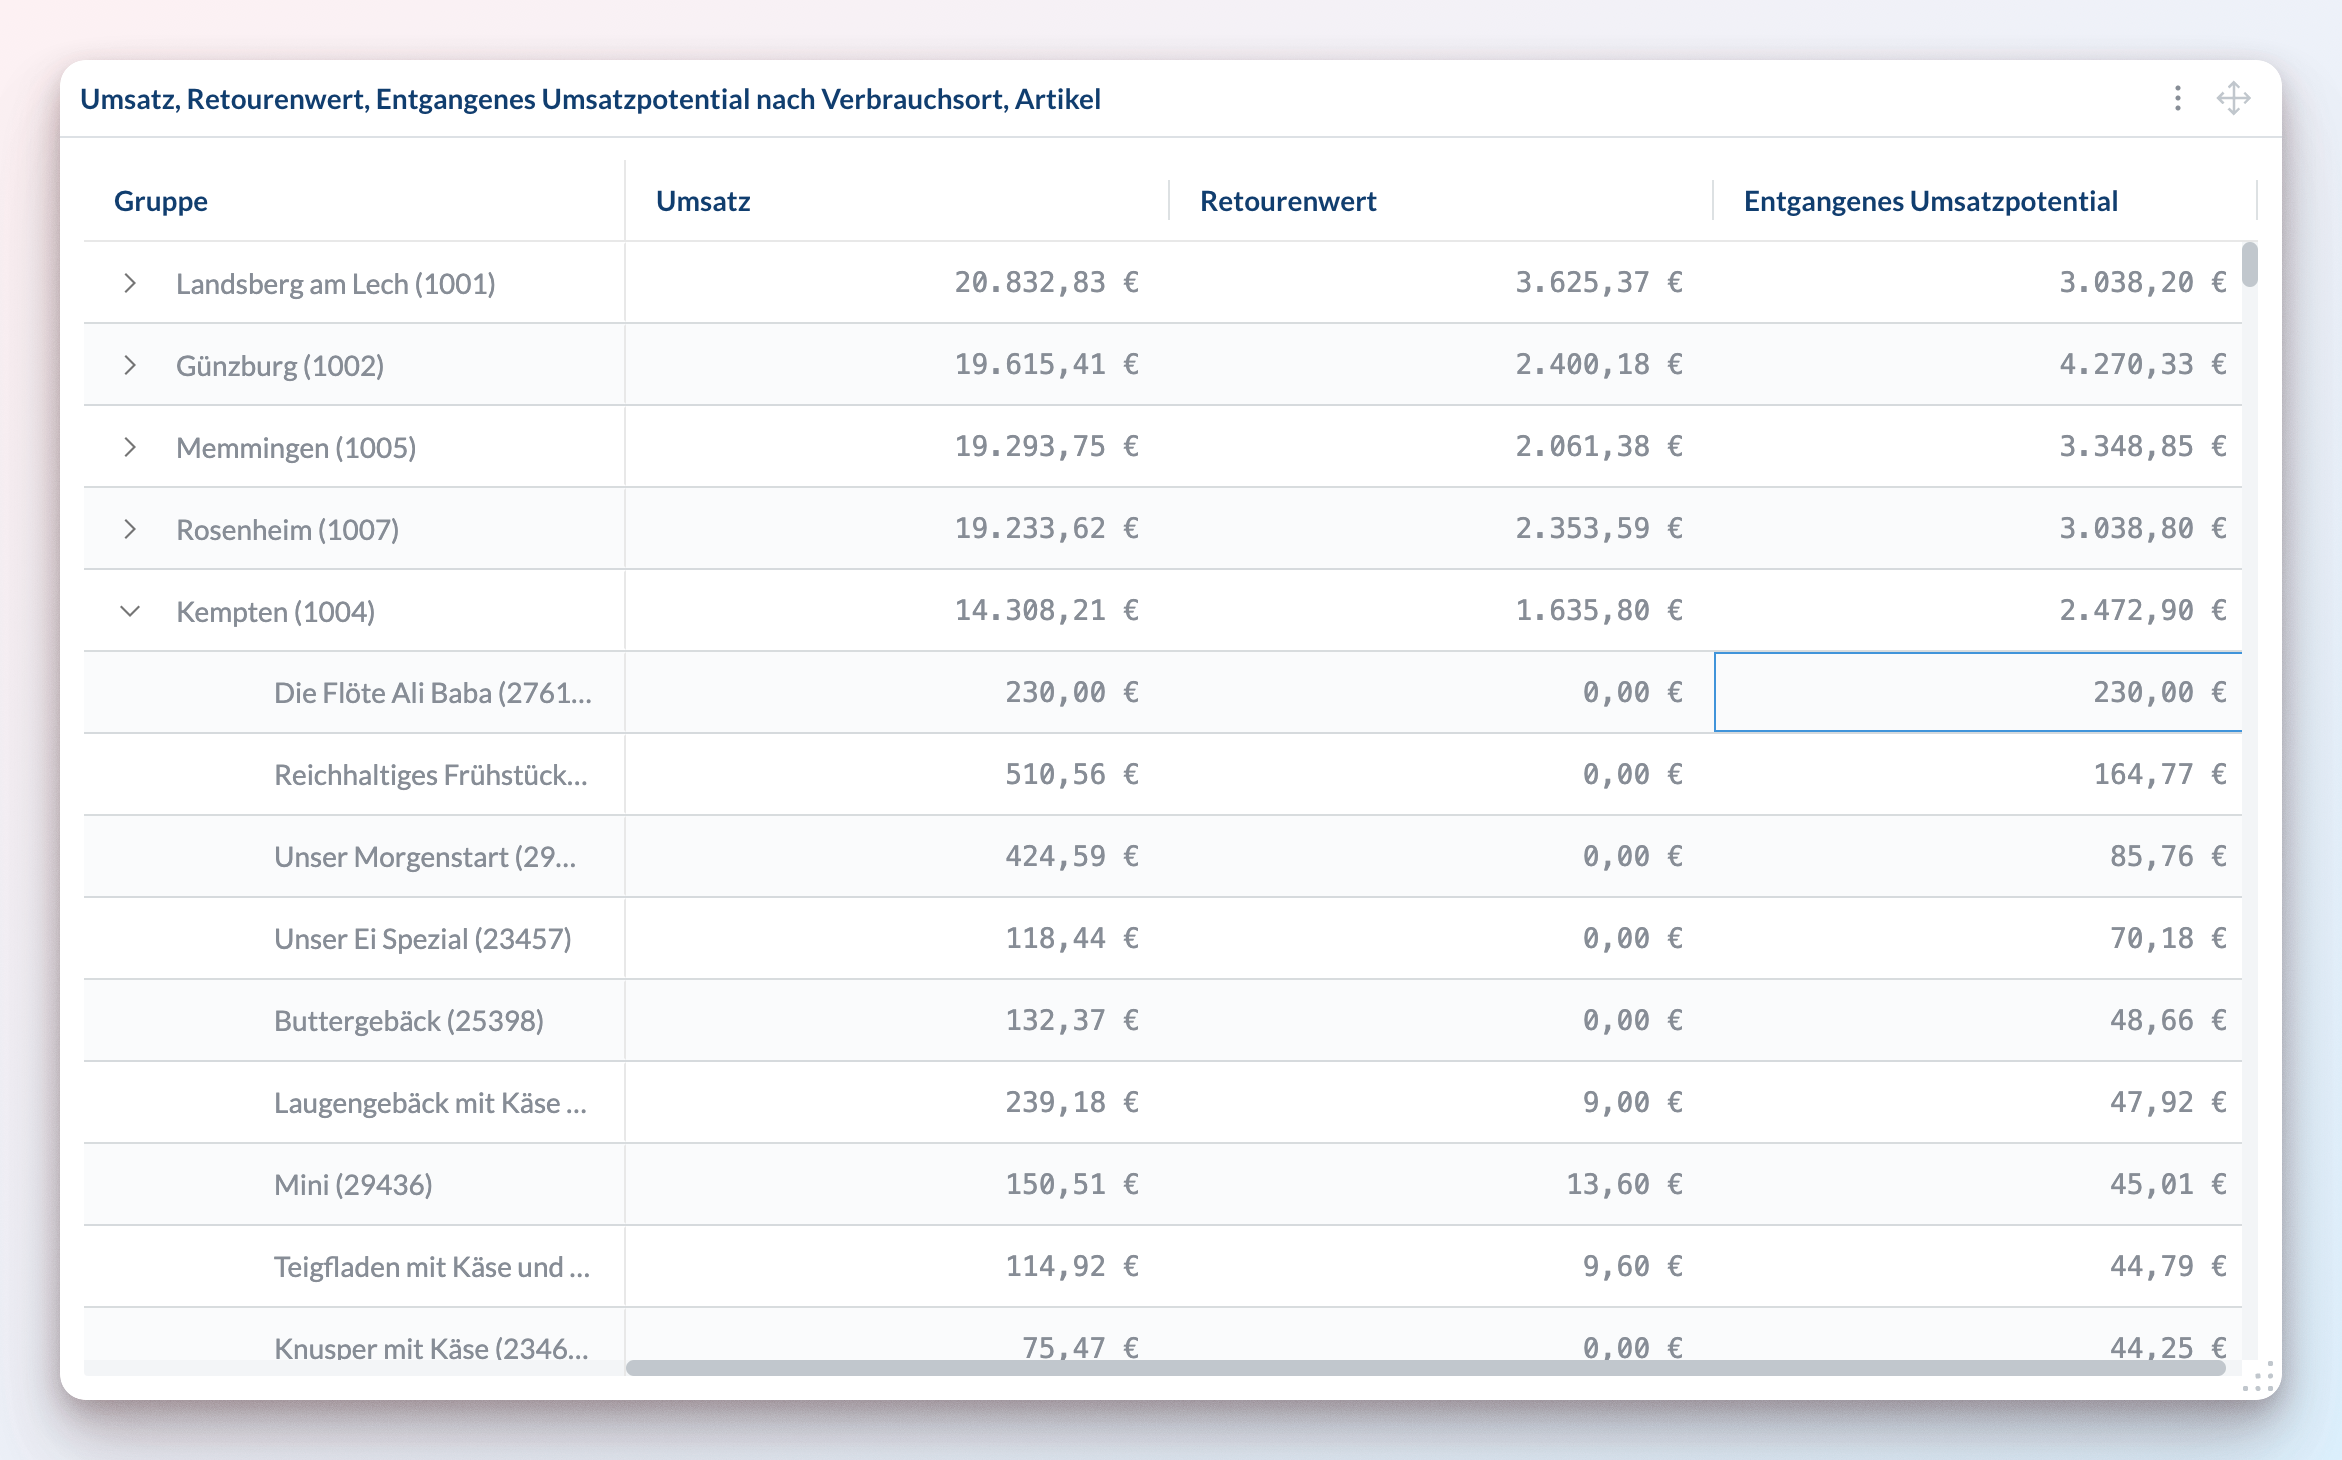
Sales potential and Lost sales potential: Revenue potential and Lost revenue potential.
Here is an example of a table that is grouped by location and item, comparing Revenue, Return value and Lost revenue potential for a whole week:
Modelling substitutability
By default, we assume that all potential sales are lost when an item stocks out. However, this isn’t always true - customers often choose a similar item instead. For example, ifLaugensemmel is out of stock, they might buy Laugenstangen or Brezel instead.
When this happens:
- The stocked-out item shows a positive
Lost sale potential, - The substitute items show a negative
Lost sales potential(because they ended up selling more than theirSales potential), and - A true loss only occurs if all substitutable items are out of stock, if they don’t stock out as a whole then the overall
Lost sale potentialis 0.
Tag substitutable items
Navigate to
Admin > Items table to add item tags:- Select items that can substitute each other
- Add the same tag to all substitutable items
- Use a consistent prefix (e.g.,
Subst-*) for easy identification
Laugensemmel and Laugenstangen with Subst-LaugenConfigure substitution rule
Go to 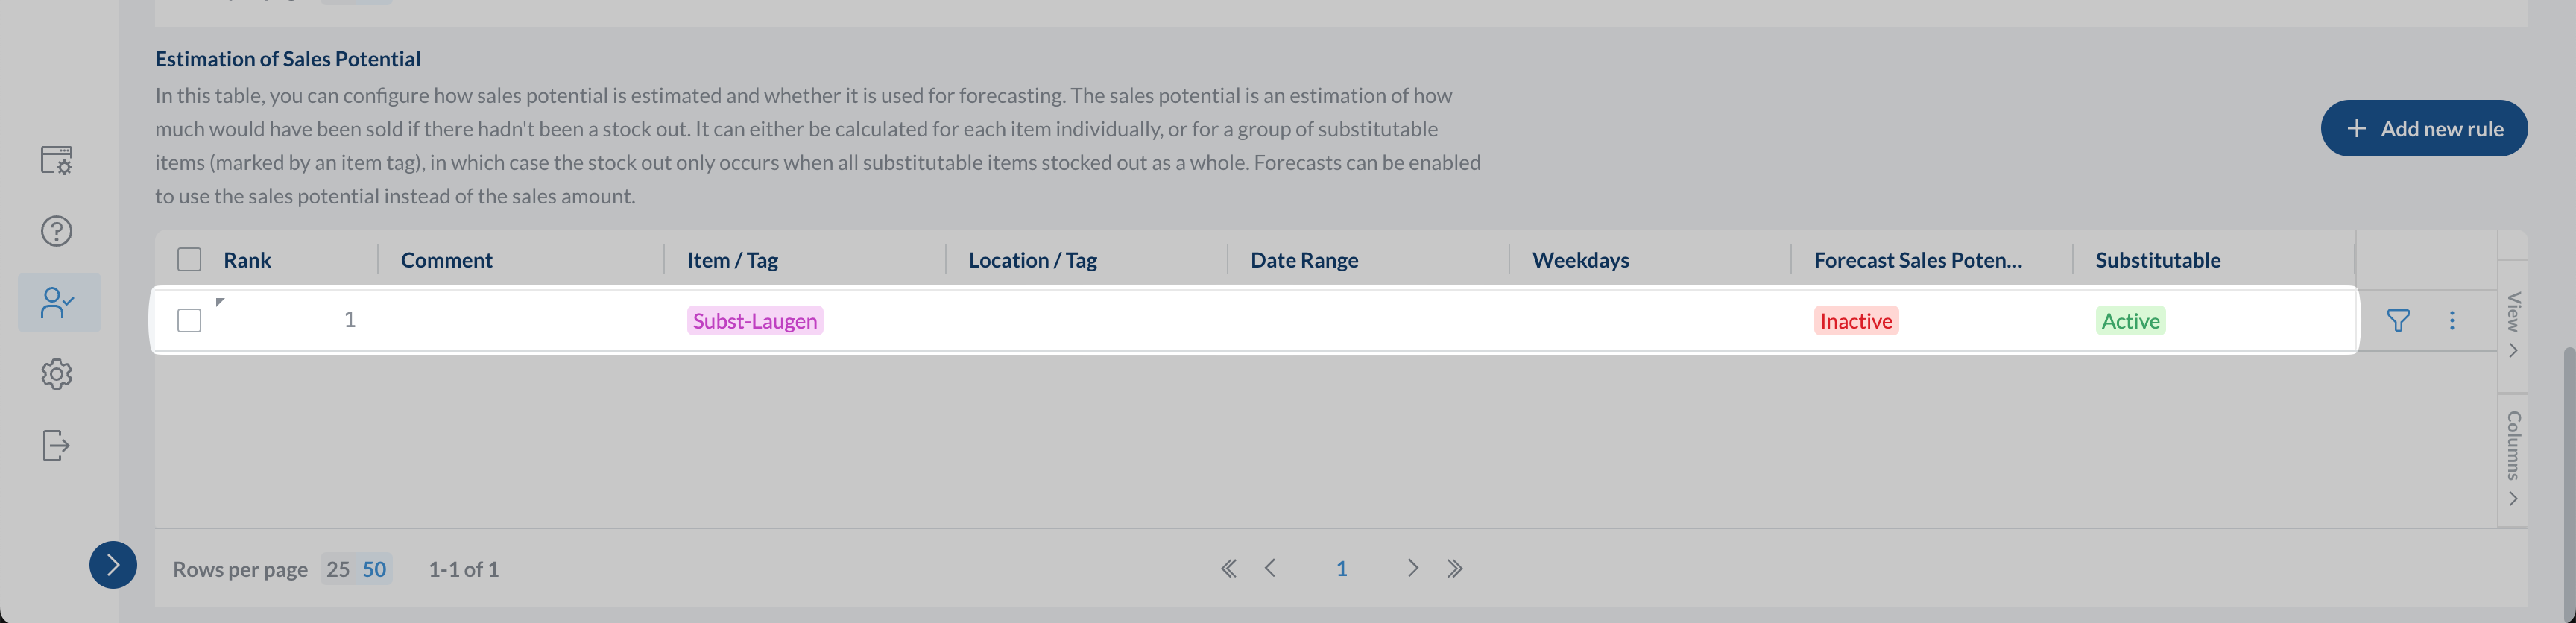
Admin > Order Config to set up the rule:- Scroll down to the
Estimation of Sales Potentialtable - Click
+ Add new rule - Limit the rule by item tag and select the tag you created
- Set the
Substitutablesetting toYes
If you use our order automation feature, you can also set the
Forecast Sales Potential setting to Yes to forecast the sales potential instead of the sold amount. More details in the orders automation documentation.Processing the rule change
After you have updated the rule the
Sales potential, Revenue potential, Lost sales potential and Lost revenue potential will be recalculated for all locations and items in our backend.
Depending on the number of items and locations affected this can take up to multiple hours.