Units
For currency based metrics (Revenue, Cost of Goods Sold, etc.), the currency is defined in the global settings and applies company wide to all locations. For count based metrics (Sales No., Planned No., etc.), the unit is the same as in the source system. For example:- If the item is sold in pieces and
Sales No. = 12.0then 12 pieces were sold. - If the item is sold in kg and
Sales No. = 3.2then 3.2 kg were sold.
Transactional vs. Aggregated Sales Data
There are two ways we can process sales data:- Daily Aggregated: Summary of your daily totals per item and location
- Transactional: Detailed data for every single sale including time, items and locations
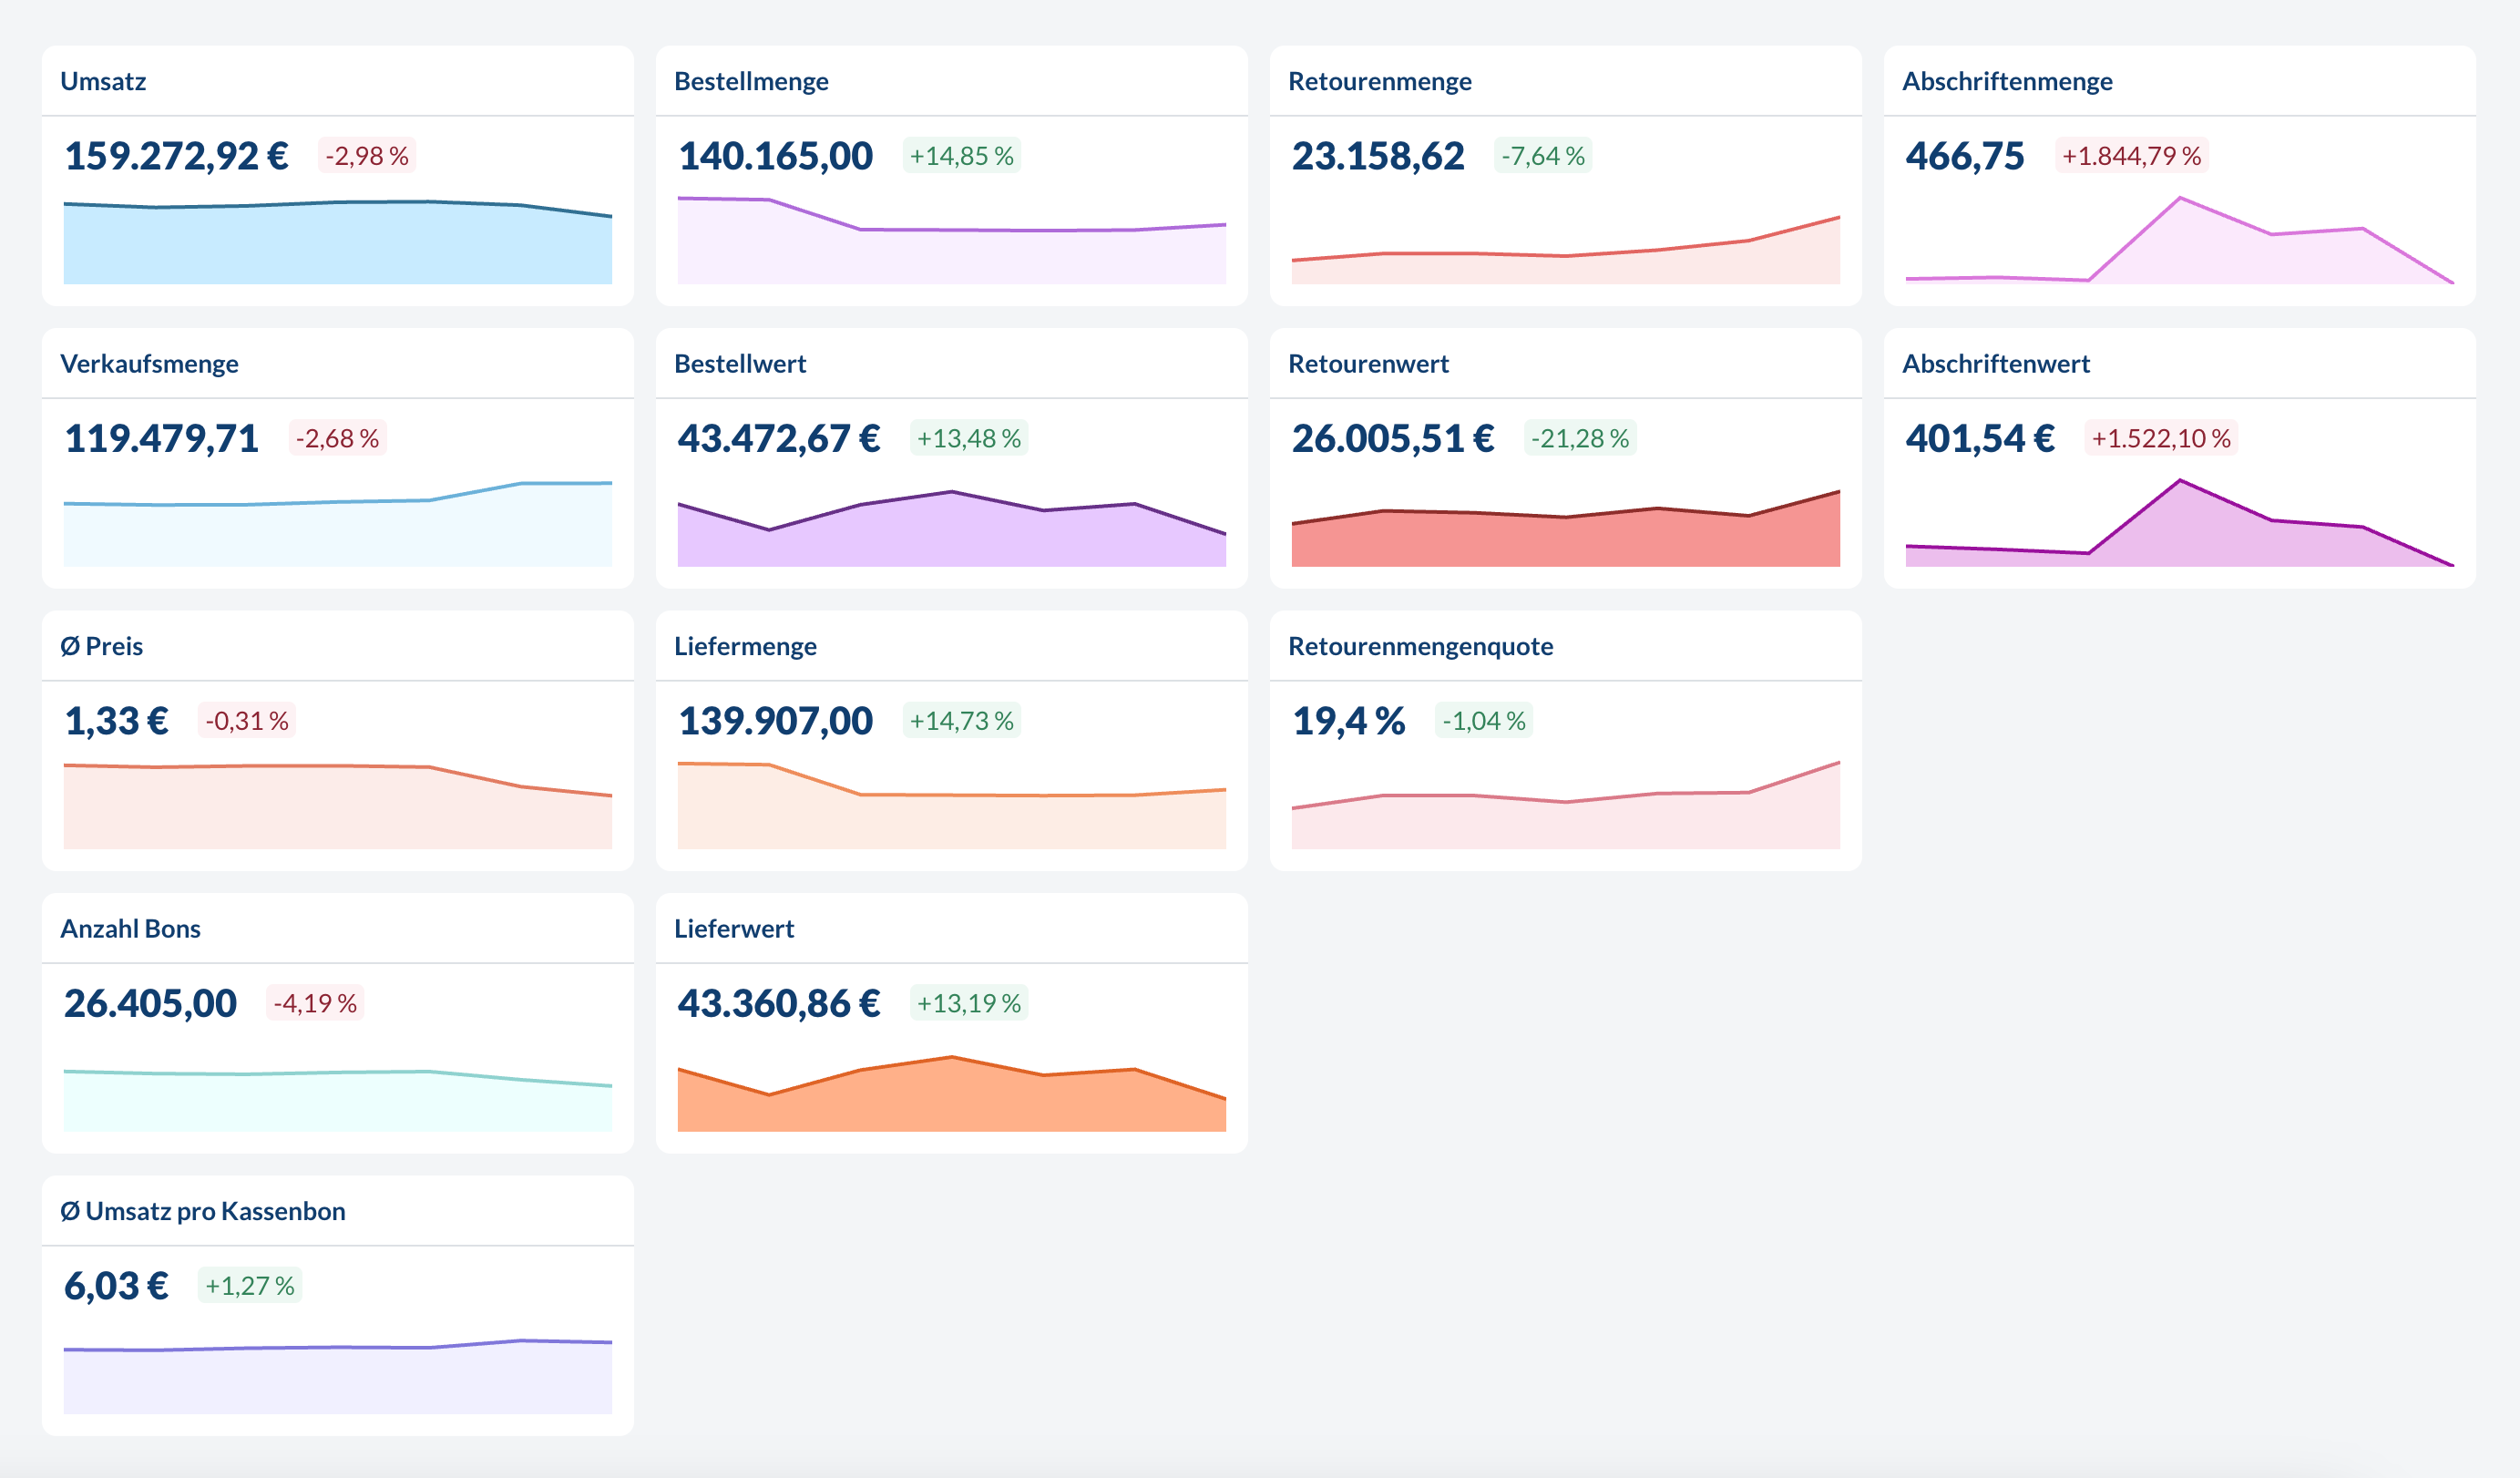
Sales Metrics
All metrics related to sales coming either from the POS or the ERP. Sales metrics can be grouped & filtered byLocation, Location-Tag, Item Offering Groups, Item, Item Groups, Item-Tag, Time (down to hourly level for transactional data, otherwise daily).
Revenue
Revenue
The total gross revenue generated from sales.
Sales No.
Sales No.
The total number of items sold.
Ø Price
Ø Price
The average price per item sold.
Transaction count
Transaction count
The total number of transactions processed.When filtering or grouping by
Item, Item Groups or Item-Tag this metric will only reflect the number of transactions which included the respective items.This metric is only available with transactional data.
Ø Revenue per transaction
Ø Revenue per transaction
The average revenue generated per customer transaction.When filtering or grouping by
Item, Item Groups or Item-Tag this metric will only reflect the average revenue per transaction of transactions which included the respective items.This metric is only available with transactional data.
Menuplanning Metrics
All metrics related to menuplanning. Menuplanning metrics can be grouped & filtered byLocation, Location-Tag, Item Offering Groups, Item, Item Groups, Item-Tag, Time (daily level only).
No. Planned
No. Planned
The planned number of portions or items to be produced for a specific menu item or dish.
Forecast No.
Forecast No.
The forecasted quantity of portions needed, calculated using predictive analytics and historical sales data.
COGS
COGS
Cost of Goods Sold represents the direct costs associated with producing menu items, including raw materials and ingredients.
Relative COGS
Relative COGS
The Cost of Goods Sold expressed as a percentage of the selling price. This metric helps evaluate profit margins and pricing strategies for menu items.
Food Waste Metrics
All metrics related to returns, write-offs and depreciation. Returns and depreciation metrics can be grouped & filtered byLocation, Location-Tag, Item, Item Groups, Item-Tag, Time (daily level only).
Depreciated amount
Depreciated amount
The quantity of items that were marked as depreciated or written off.
Depreciated value
Depreciated value
The monetary value of all depreciated items.
Return amount
Return amount
The quantity of items that were returned.
Return value
Return value
The monetary value of all returned items.
Return amount rate
Return amount rate
Depending on the configuration this is the percentage of items that were returned relative to
- total delivered items or
- the total sold items.
Return value rate
Return value rate
This is the
return amount rate weighted by the value of the items.