Create Dashboards
Build targeted views for every business scenario - from operational monitoring to strategic analysis
Choose Report Types
Select from powerful visualizations designed to highlight key business insights
Optimize Layouts
Access your business data anywhere with responsive dashboards that work on any device
Filter & Analyze
Instantly analyze specific data segments with advanced filtering and comparison capabilities
Share Dashboards
Keep everyone informed with dashboards that update in real-time
Email Subscriptions
Get regular Email updates of your favorite dashboards
AI Insights
Get AI insights in the dashboard and your email updates
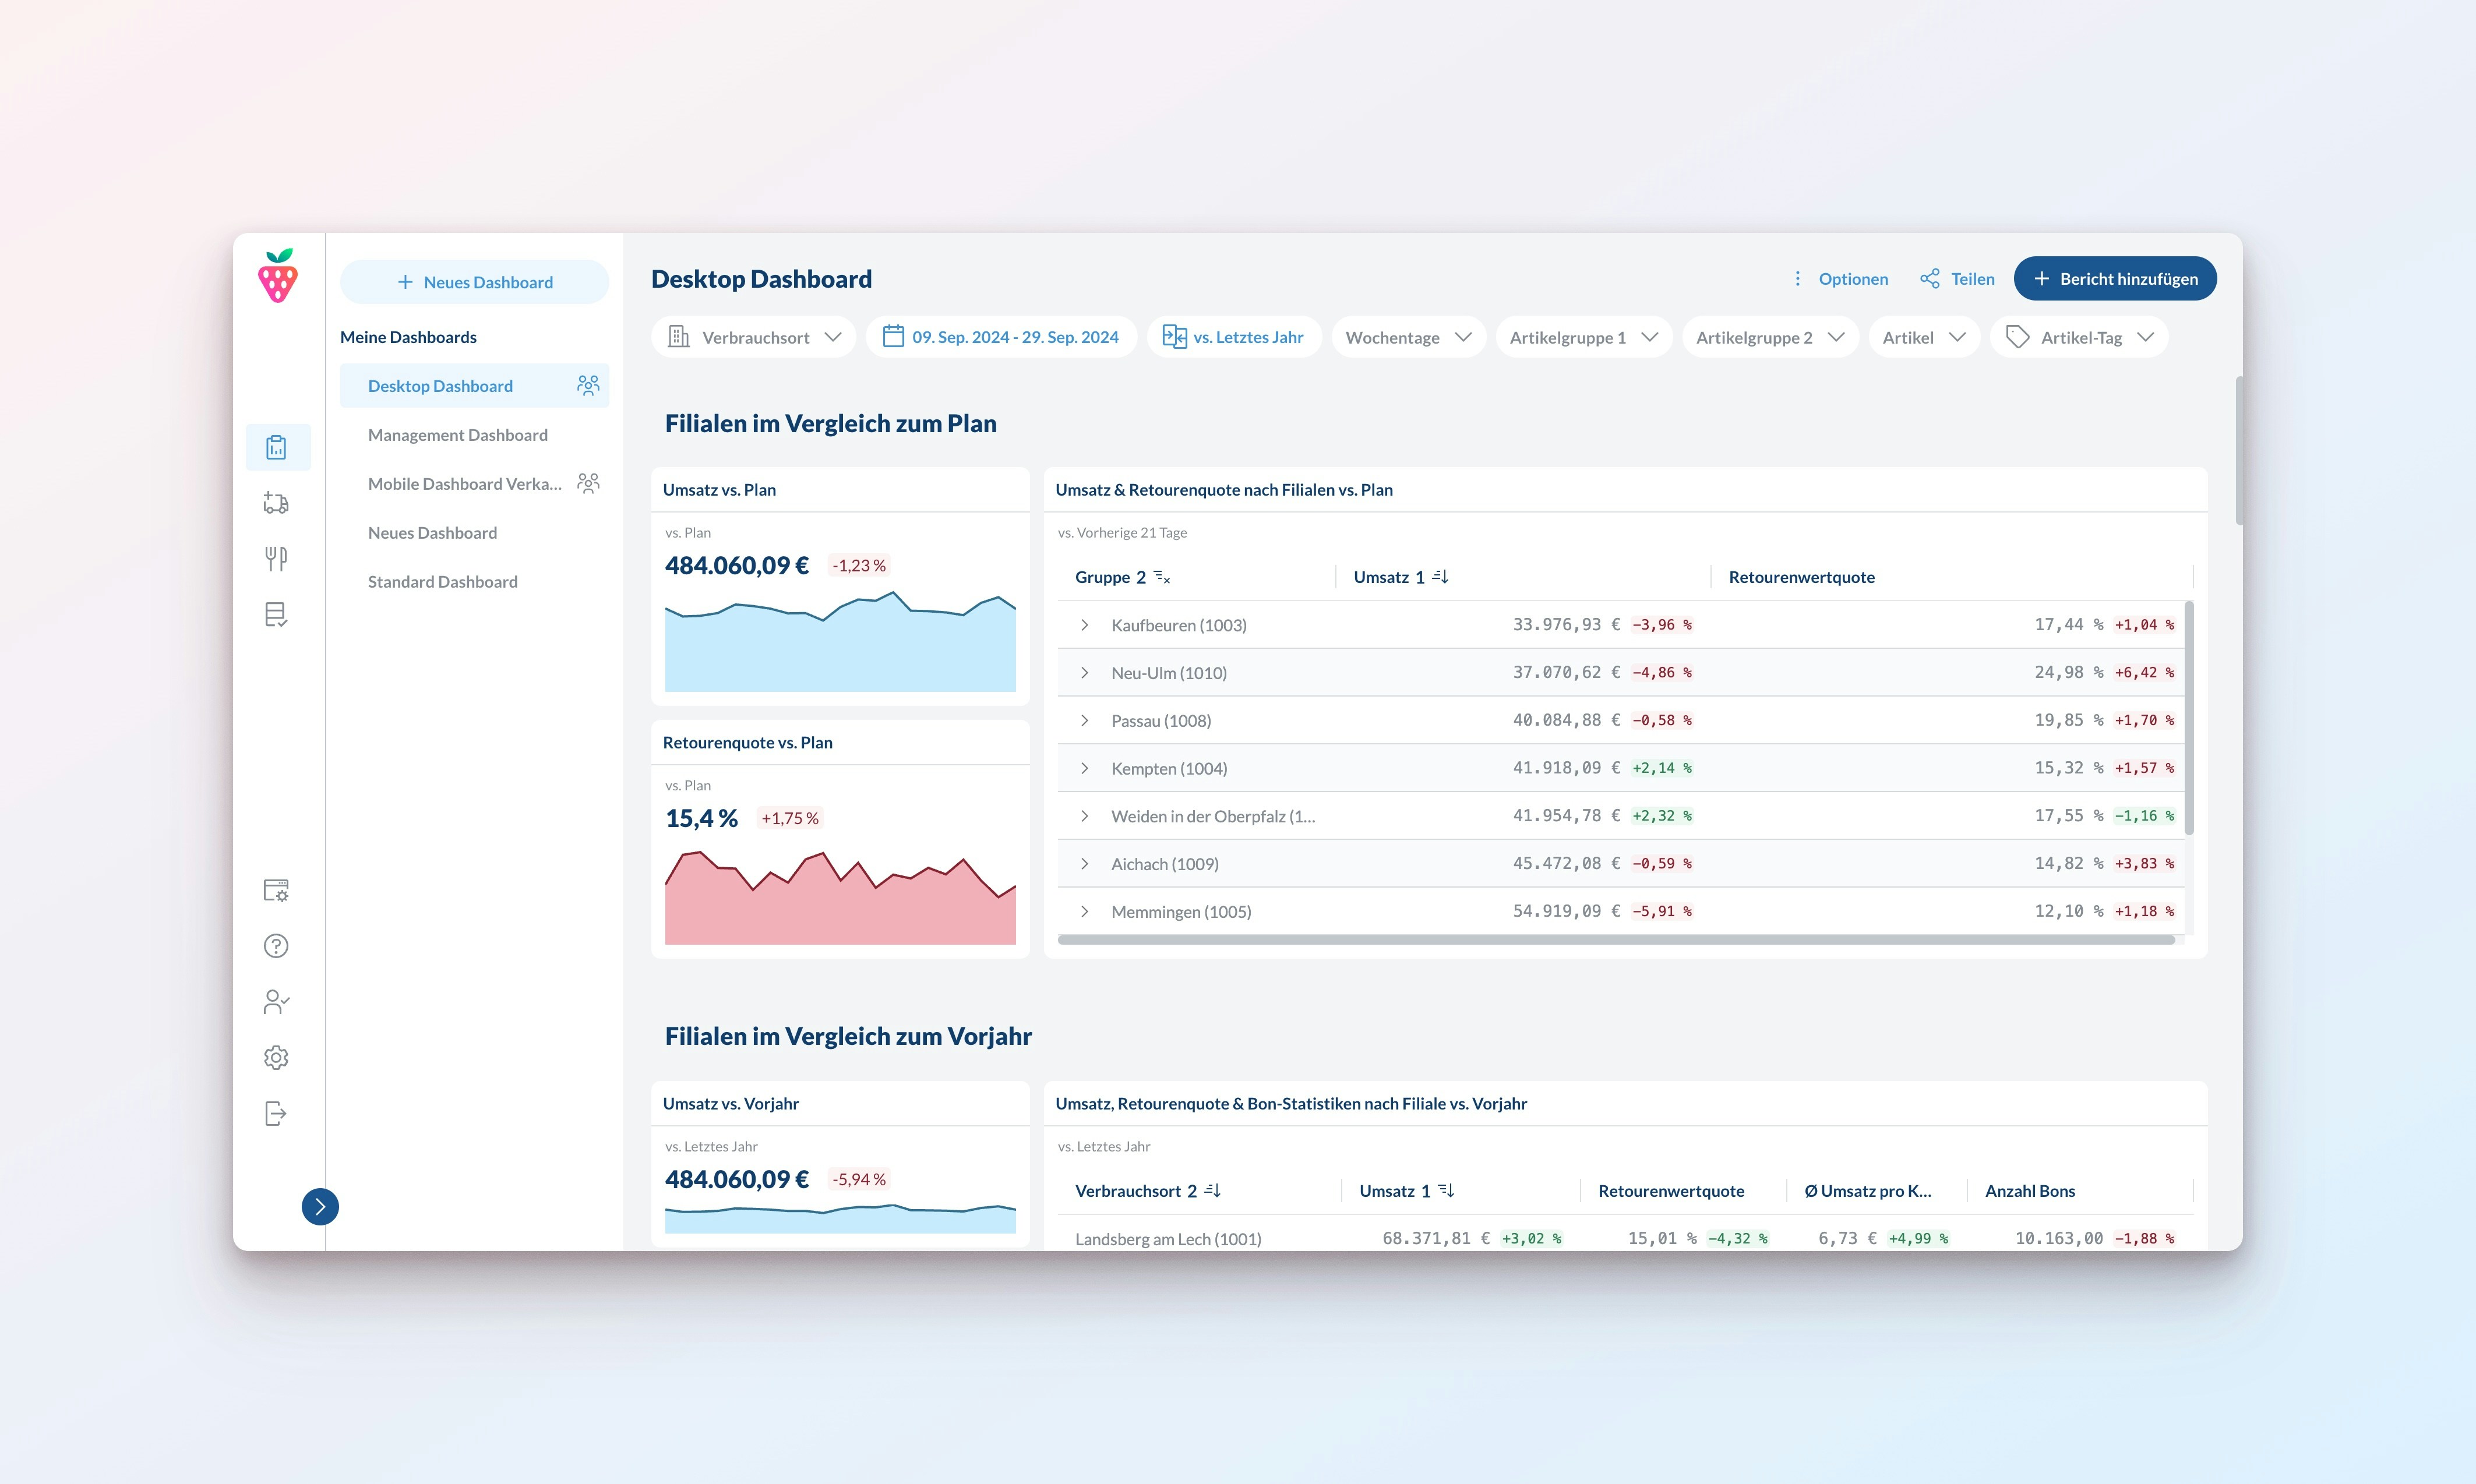
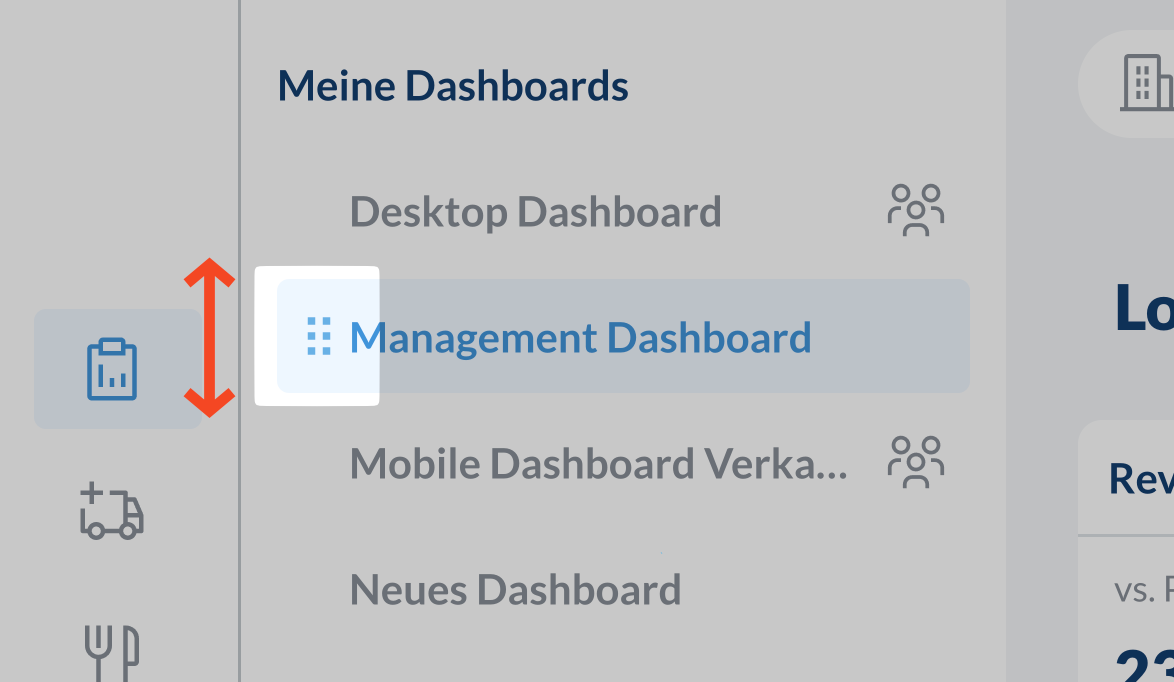
Create Dashboards
Get started with dashboards that perfectly match your needs:Create a Dashboard
- Click
+ Create Dashboardon the top left to start from scratch, or - Click
⋮ Options>Duplicateon an existing dashboard to create a variation
Choose Report Types
Select the optimal visualization type for your business data: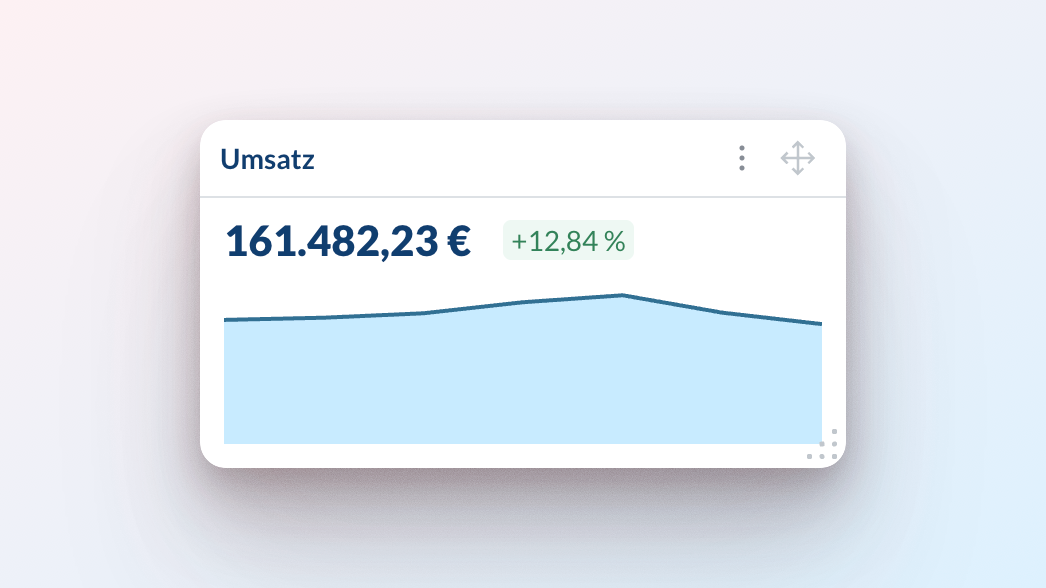
Mini Chart
Perfect for monitoring critical performance indicators and quick trend analysis.
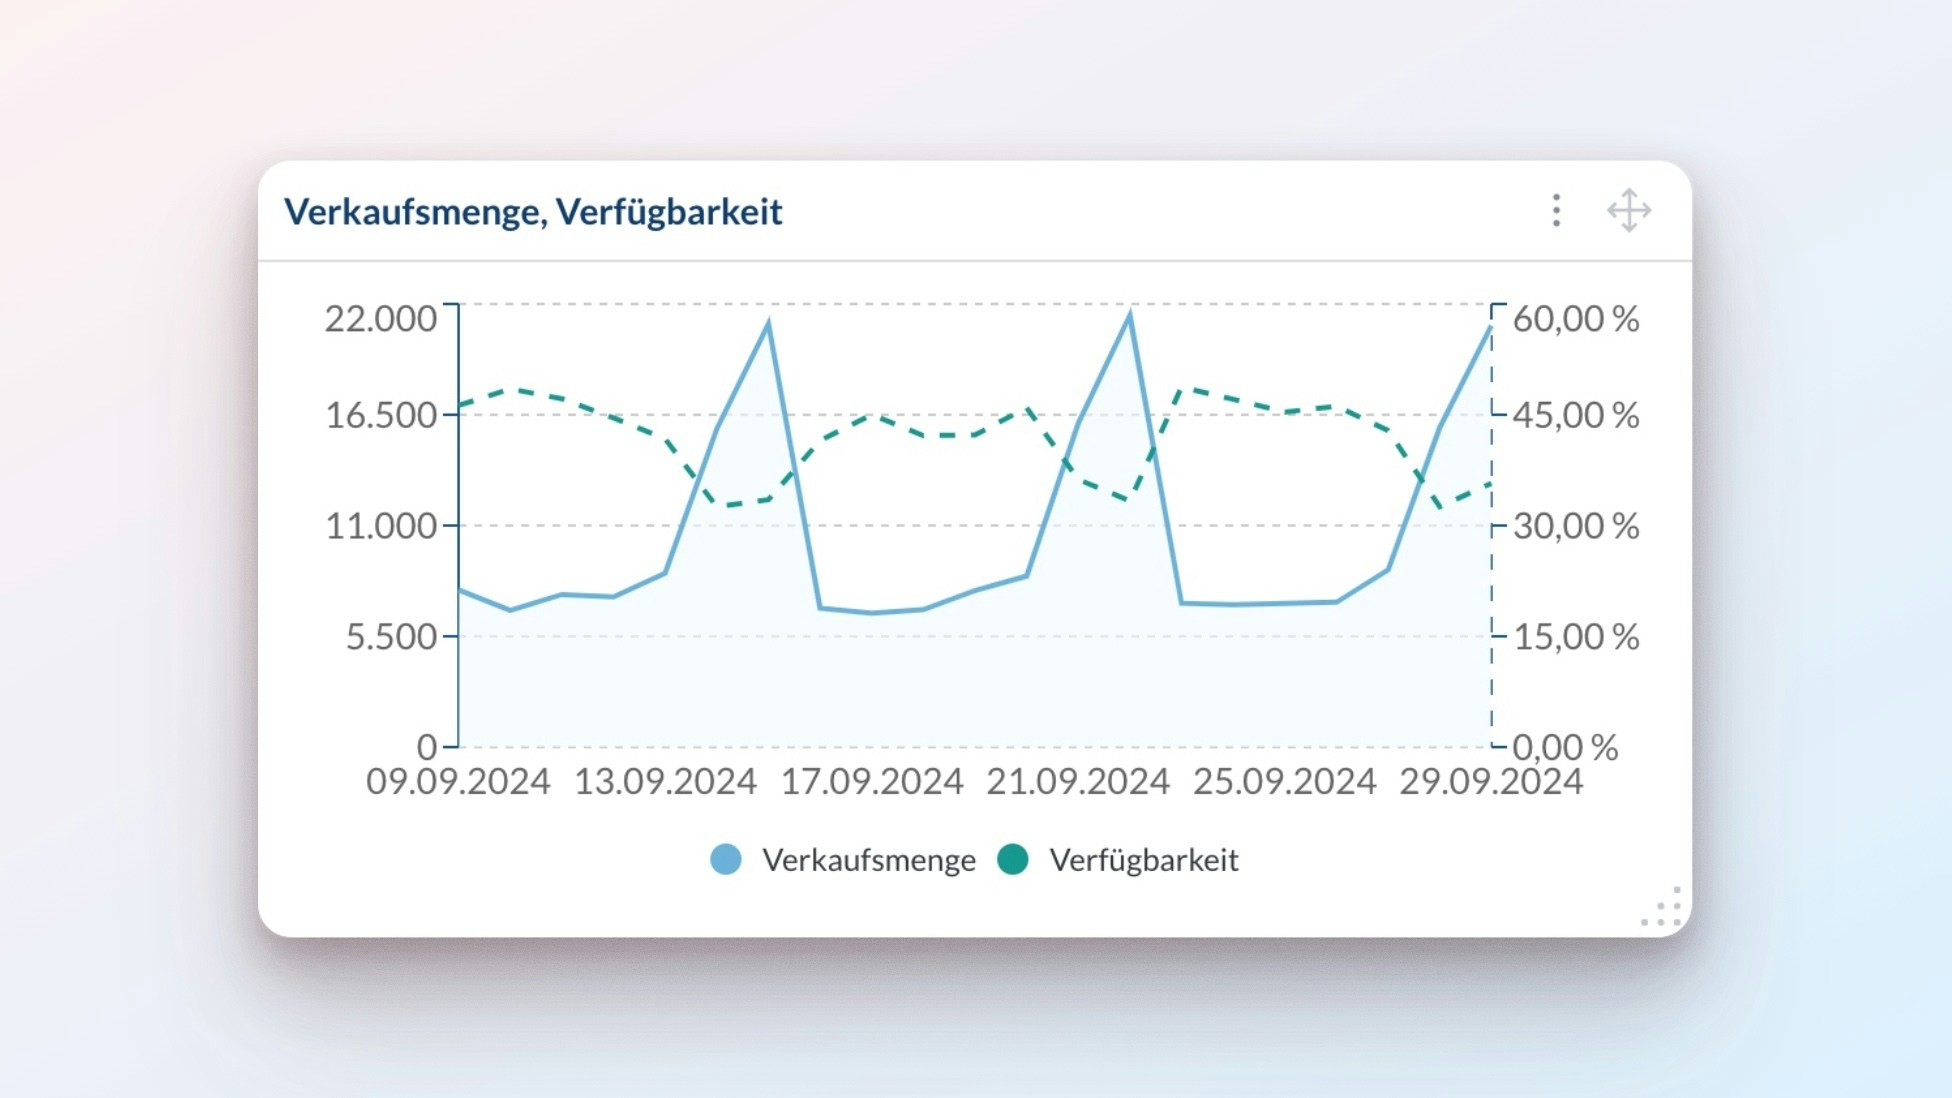
Line Chart
Analyze trends and identify patterns in your business metrics over time.
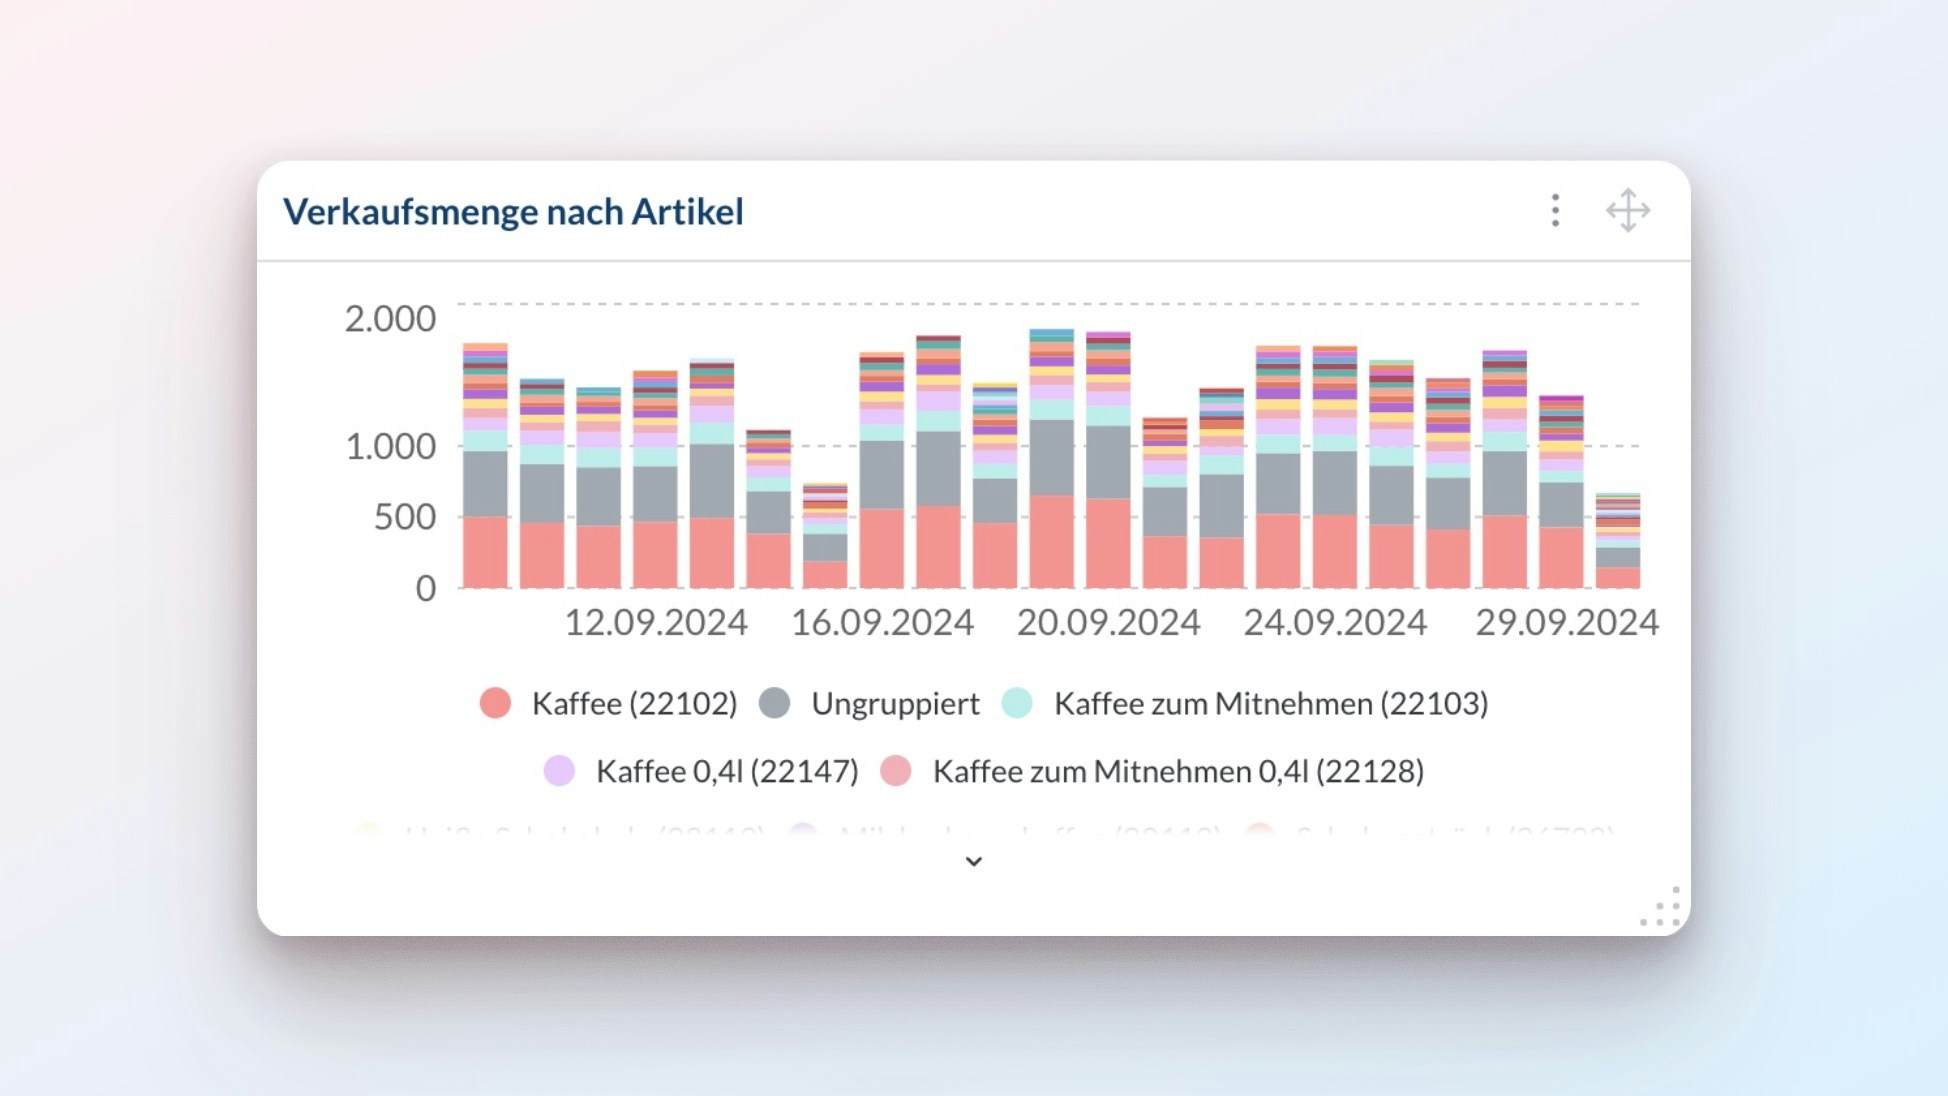
Bar Chart
Compare performance metrics across business units, locations, or product categories.
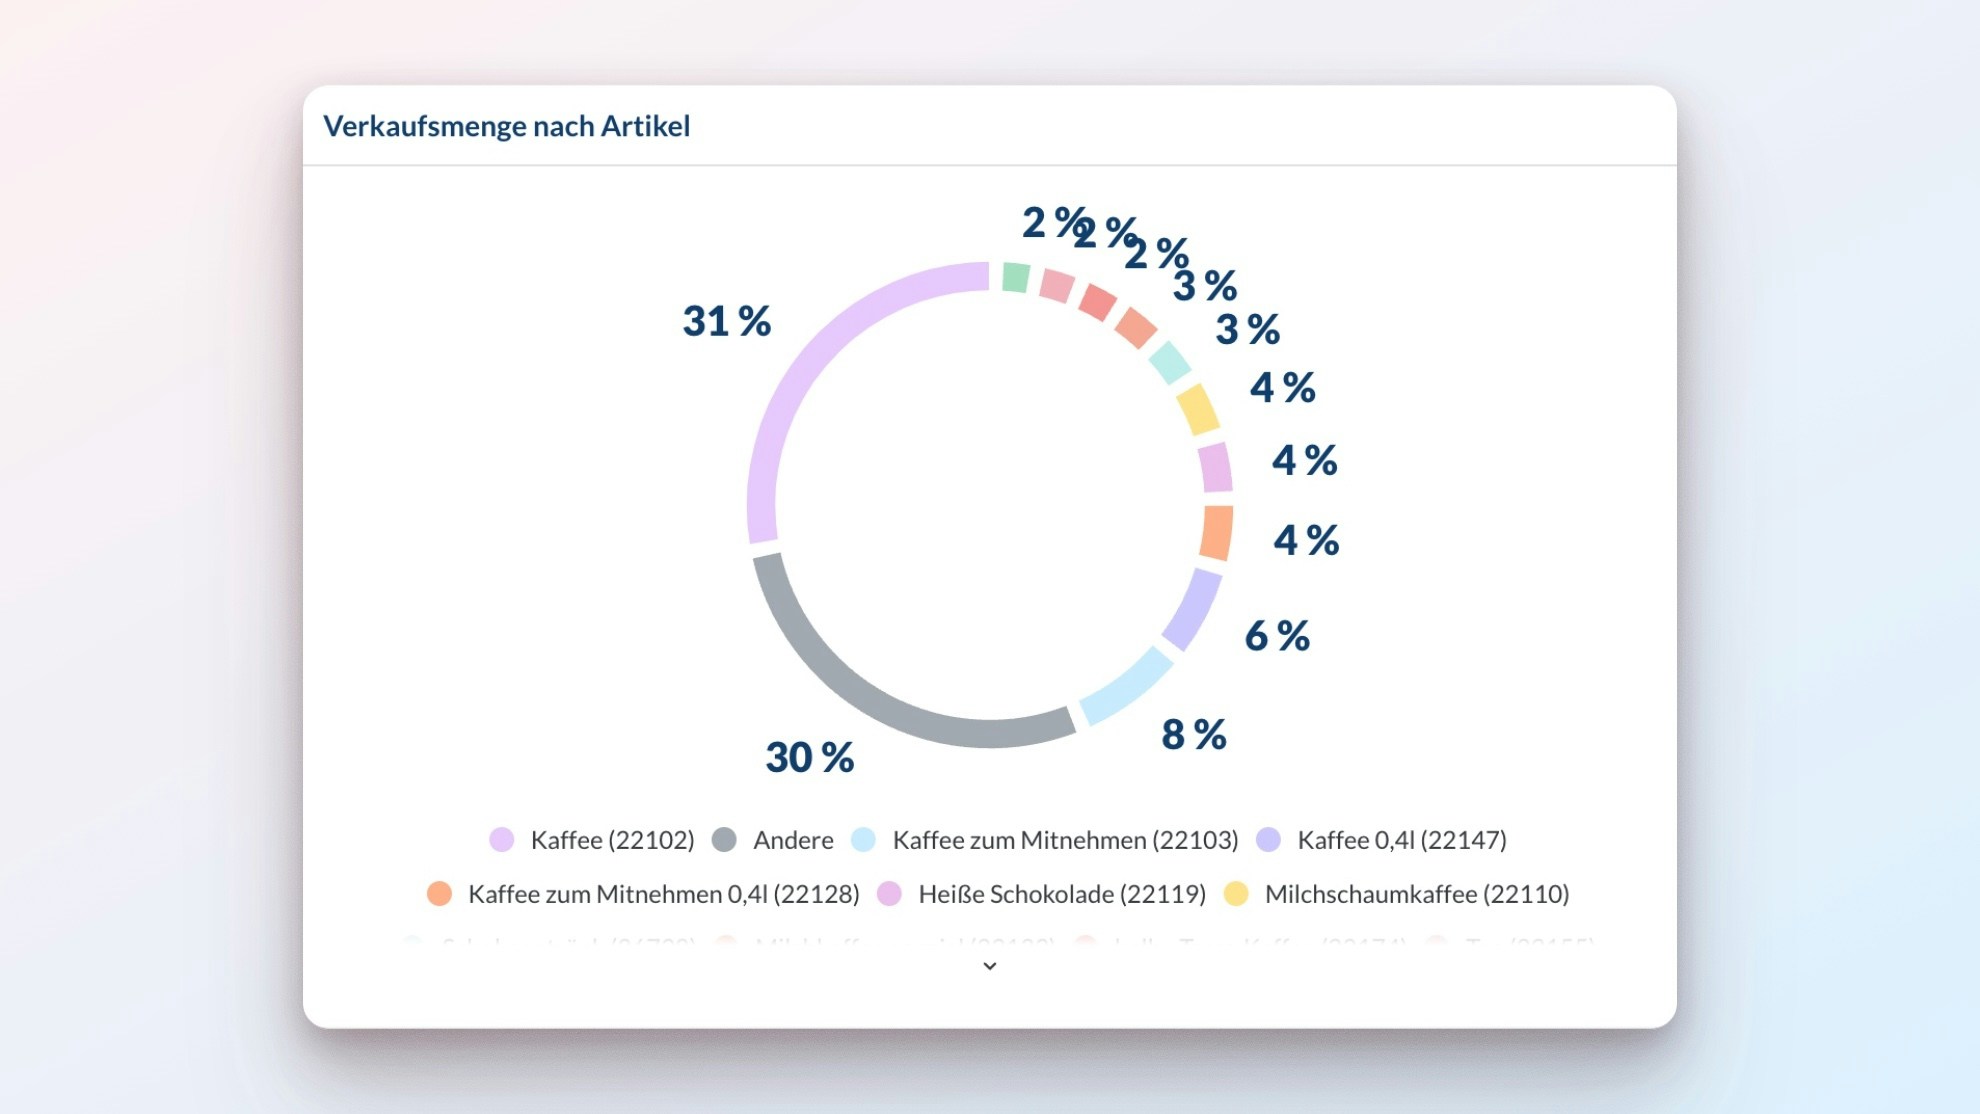
Pie Chart
Visualize market share, revenue distribution, and other proportional metrics.
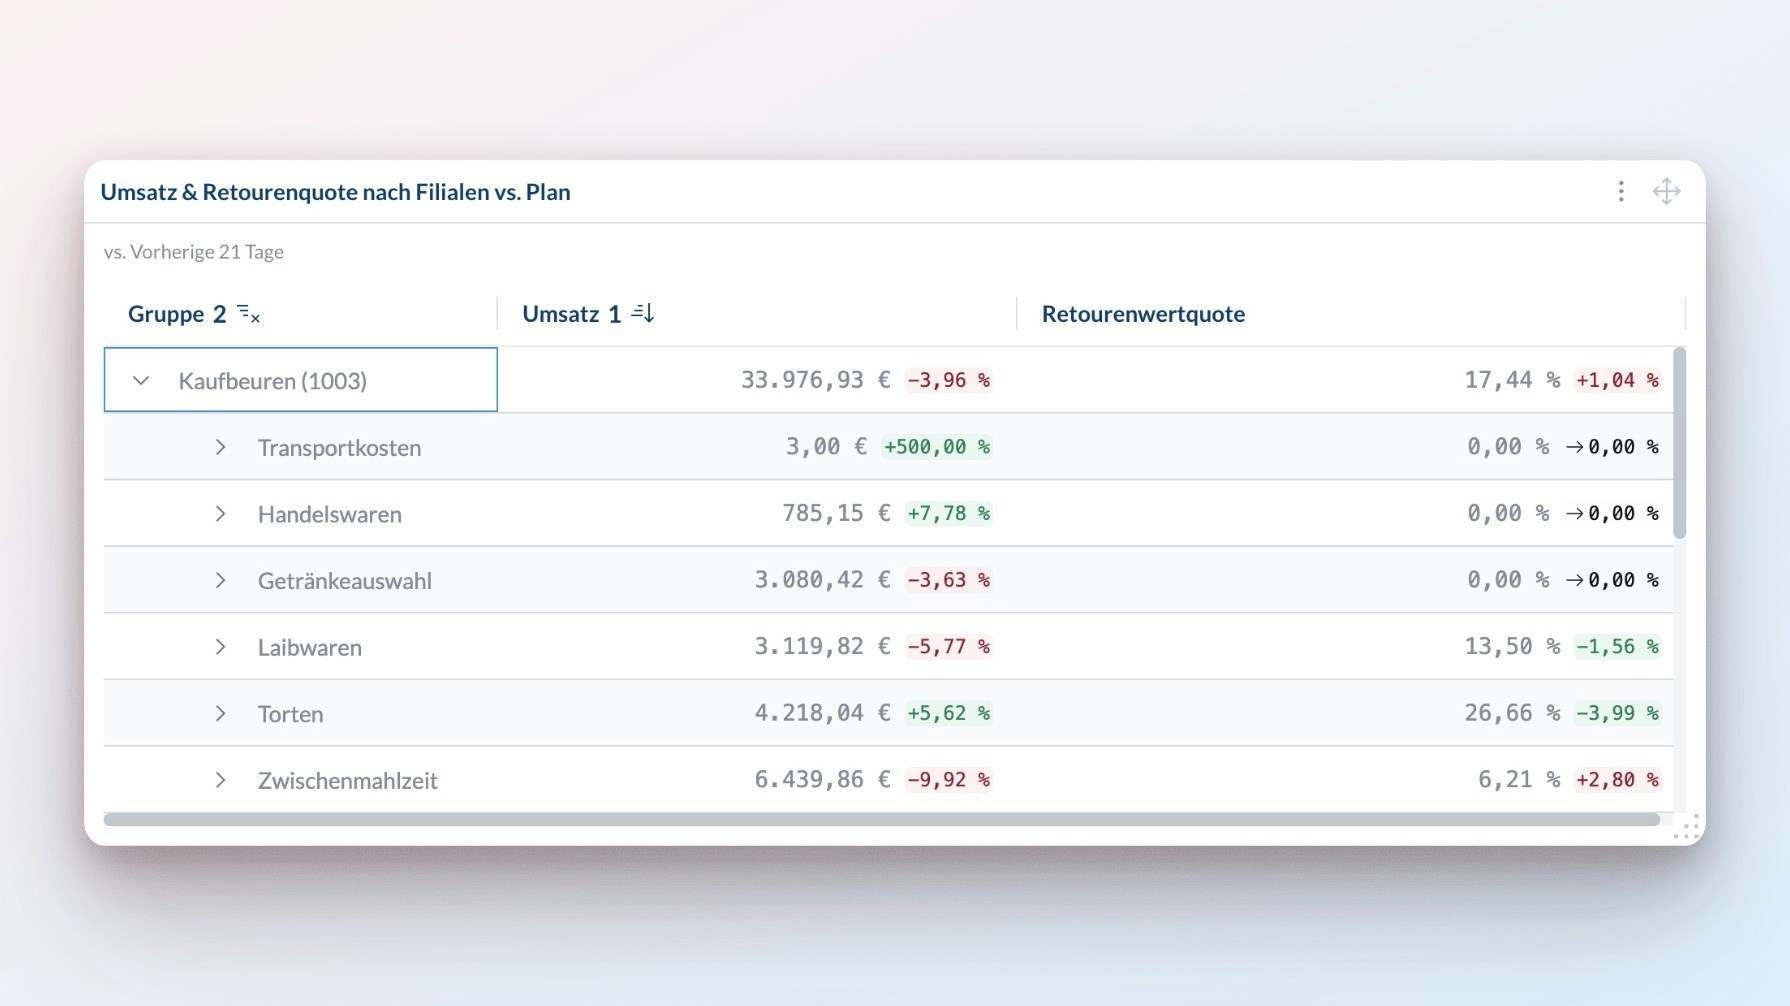
Table
Access comprehensive data views with advanced sorting and filtering capabilities.
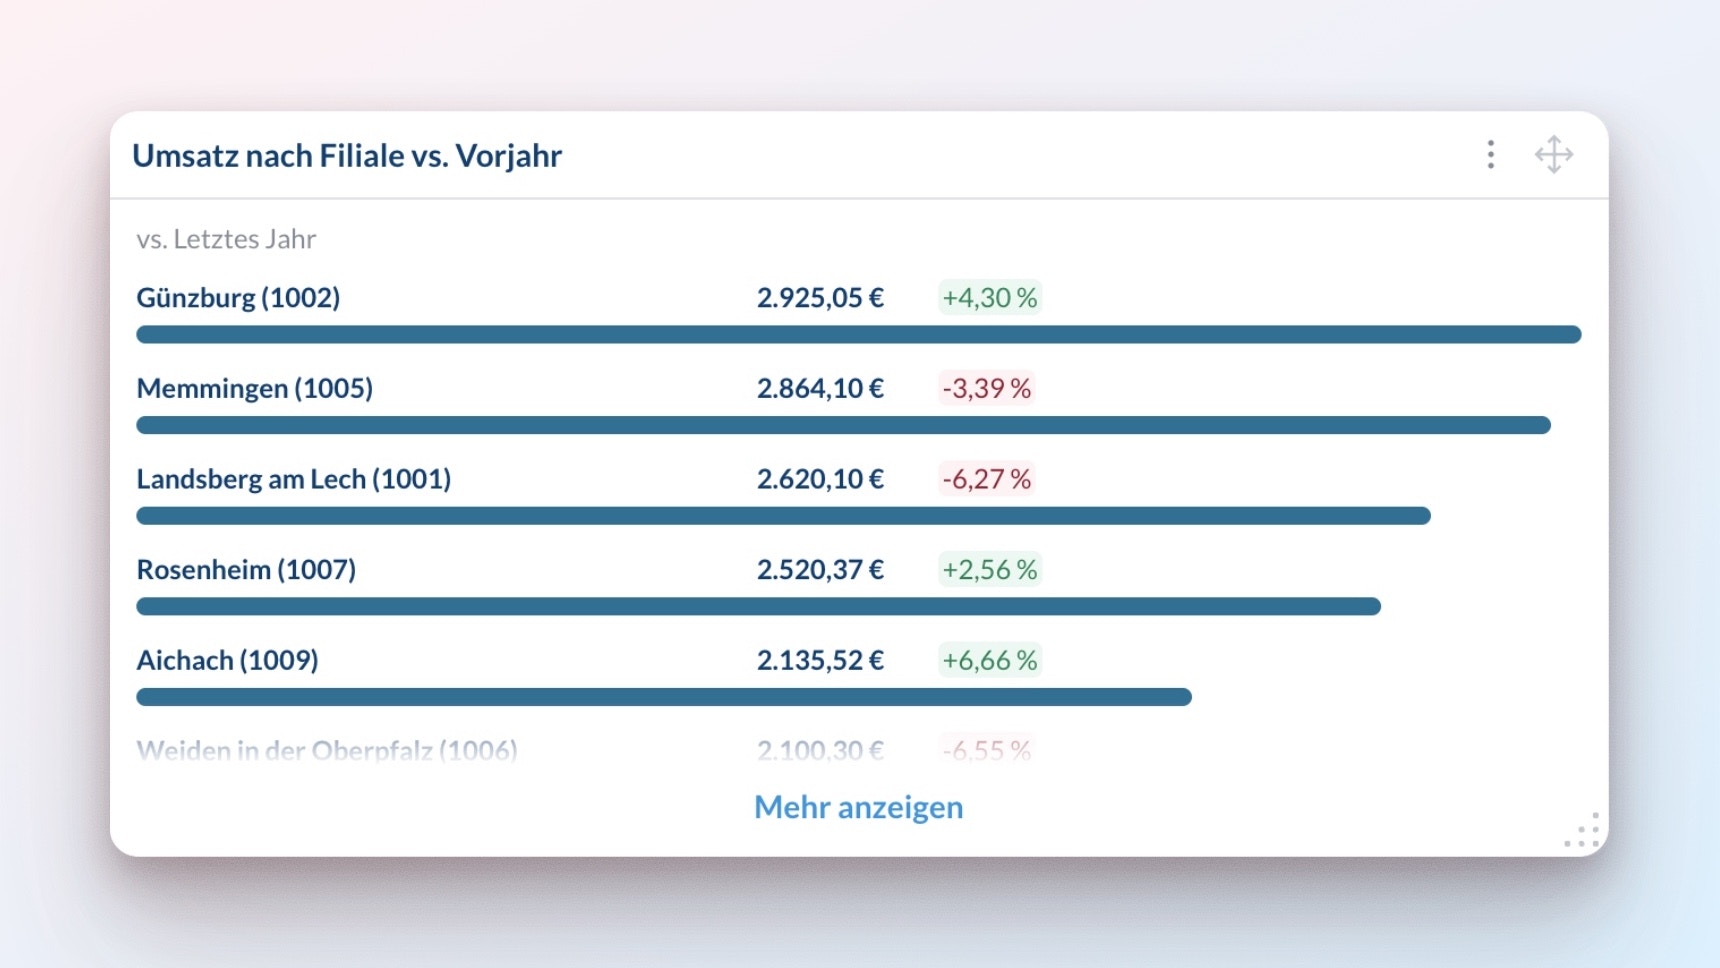
List
Track top performers and key rankings in a mobile-optimized format.
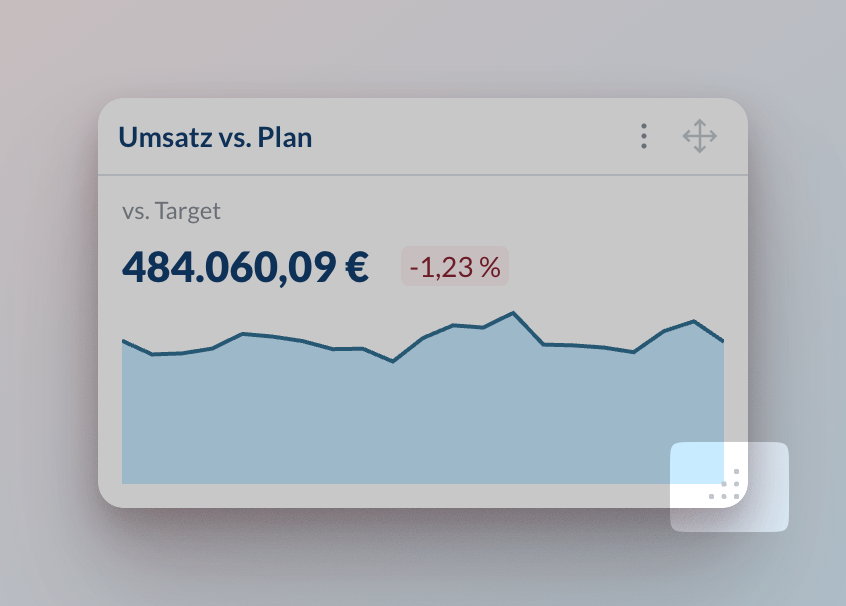
Optimize Layouts
Create dashboards that look great on every device: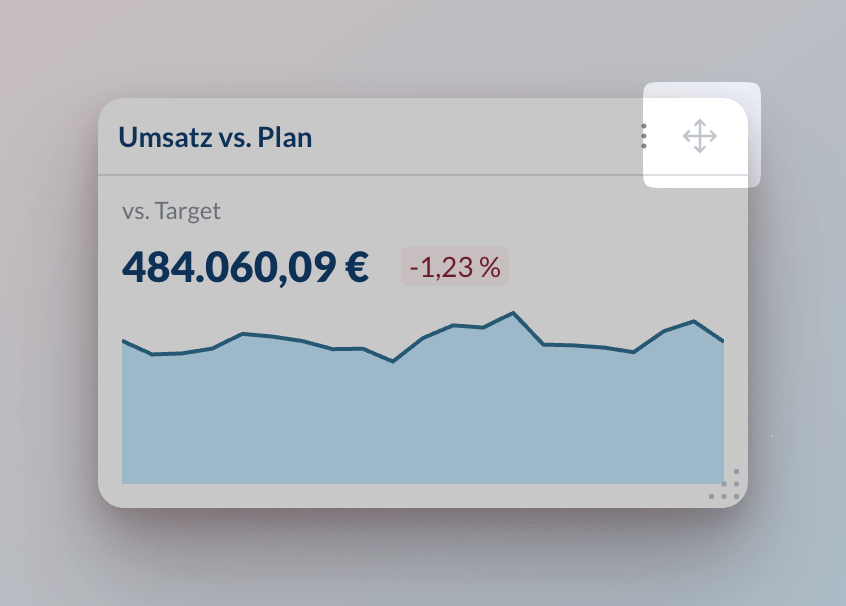
Add Context with Text Reports
Use text reports to guide your team through the data: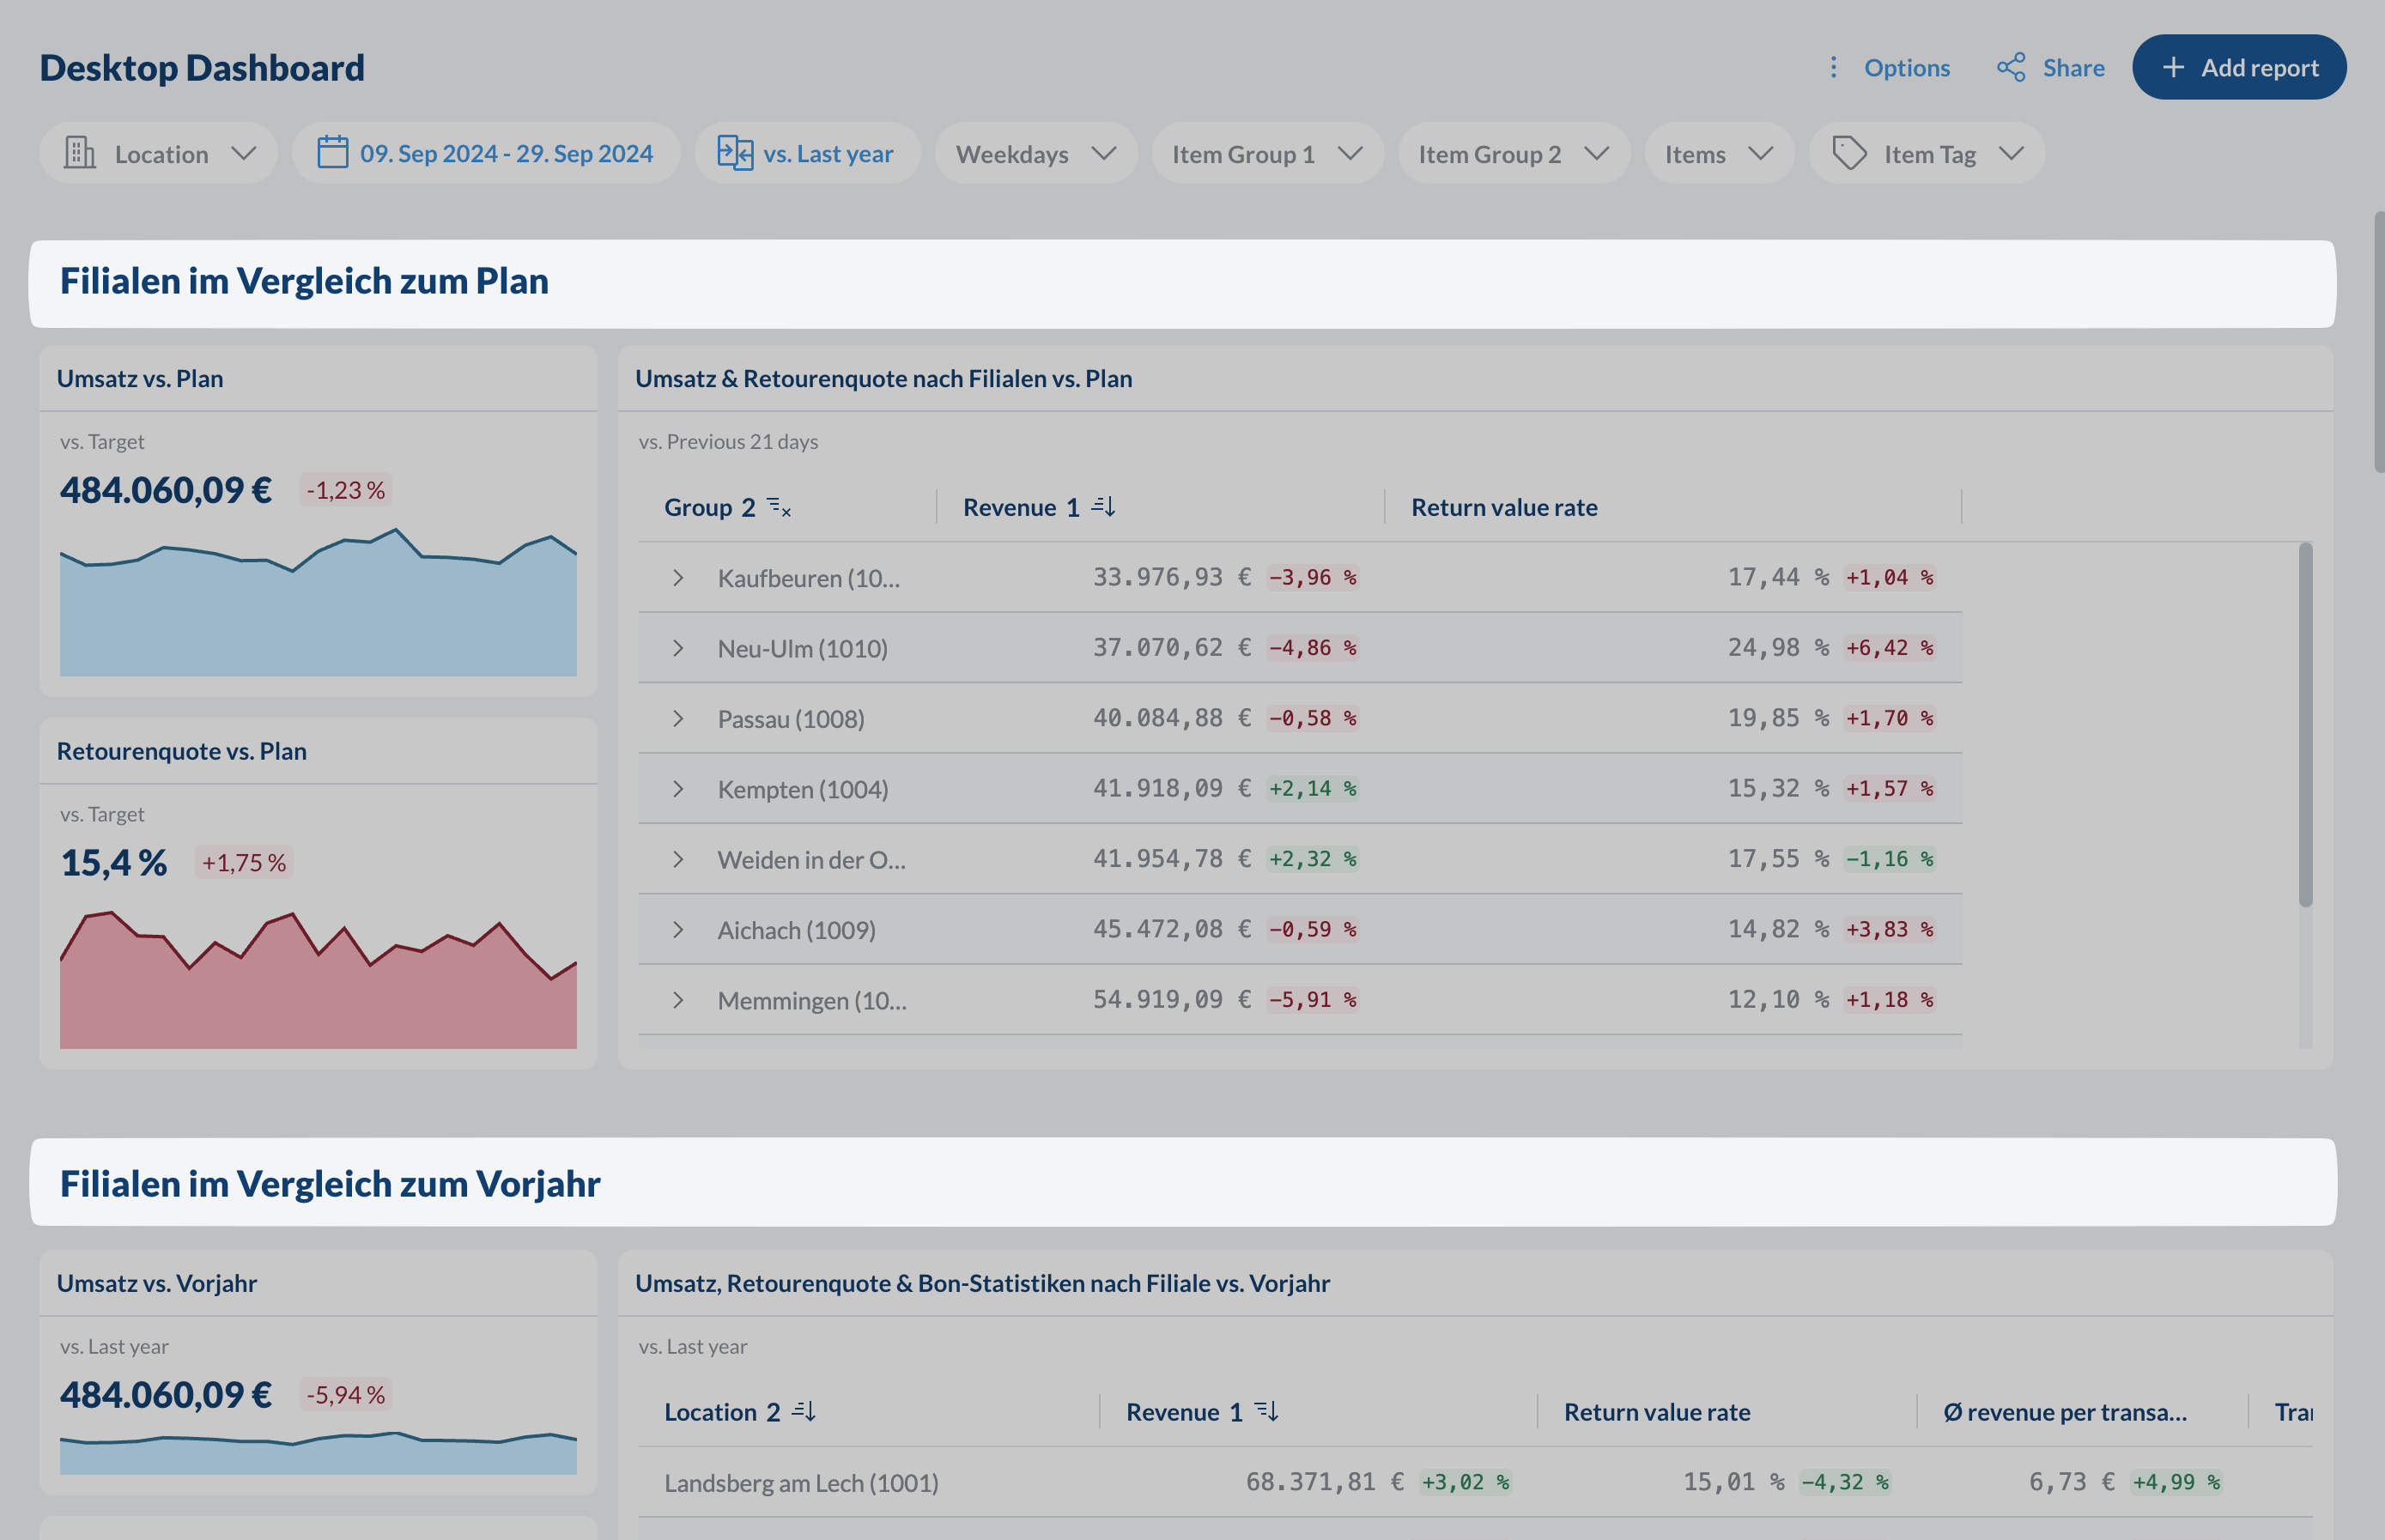
Filter and Analyze
Zero in on the exact data you need with powerful filtering options:Dashboard Filters
Every dashboard comes with filters at the top that work across all reports: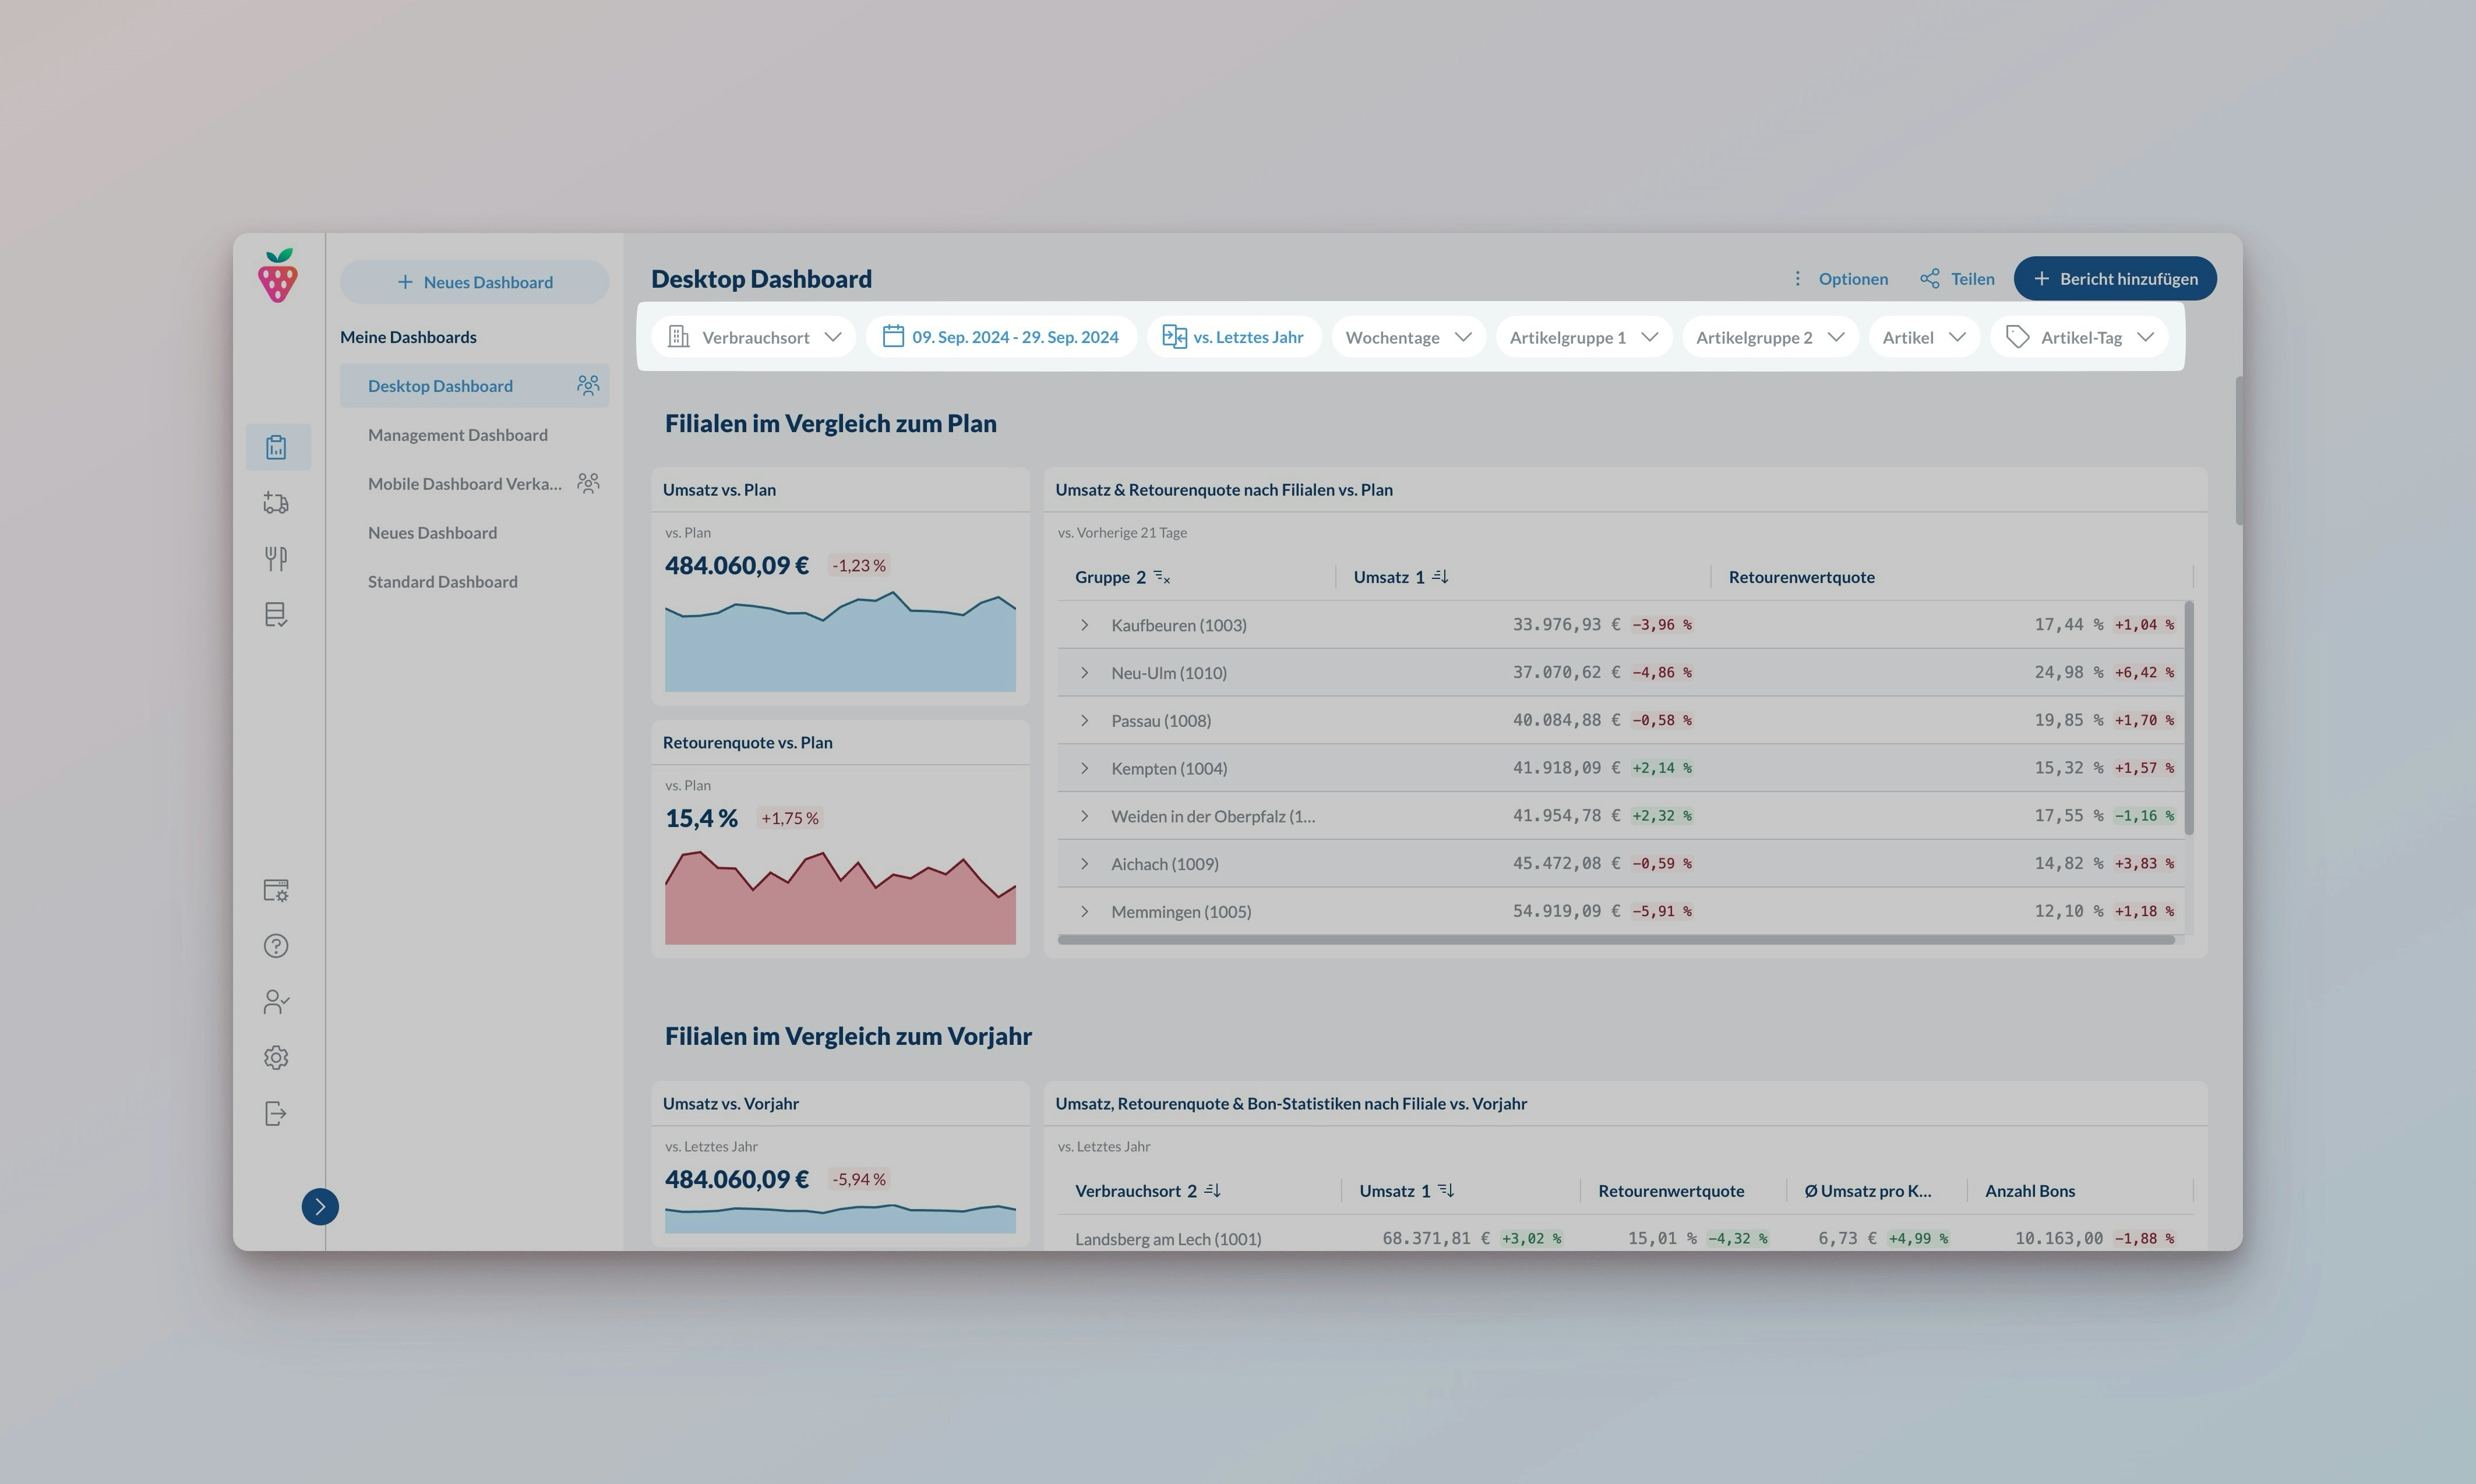
Location Filter
Compare stores and regions
Location Filter
Compare stores and regions
Groups: Pre-set location collections like “Region North” or “Region South”Locations: Individual stores for detailed analysis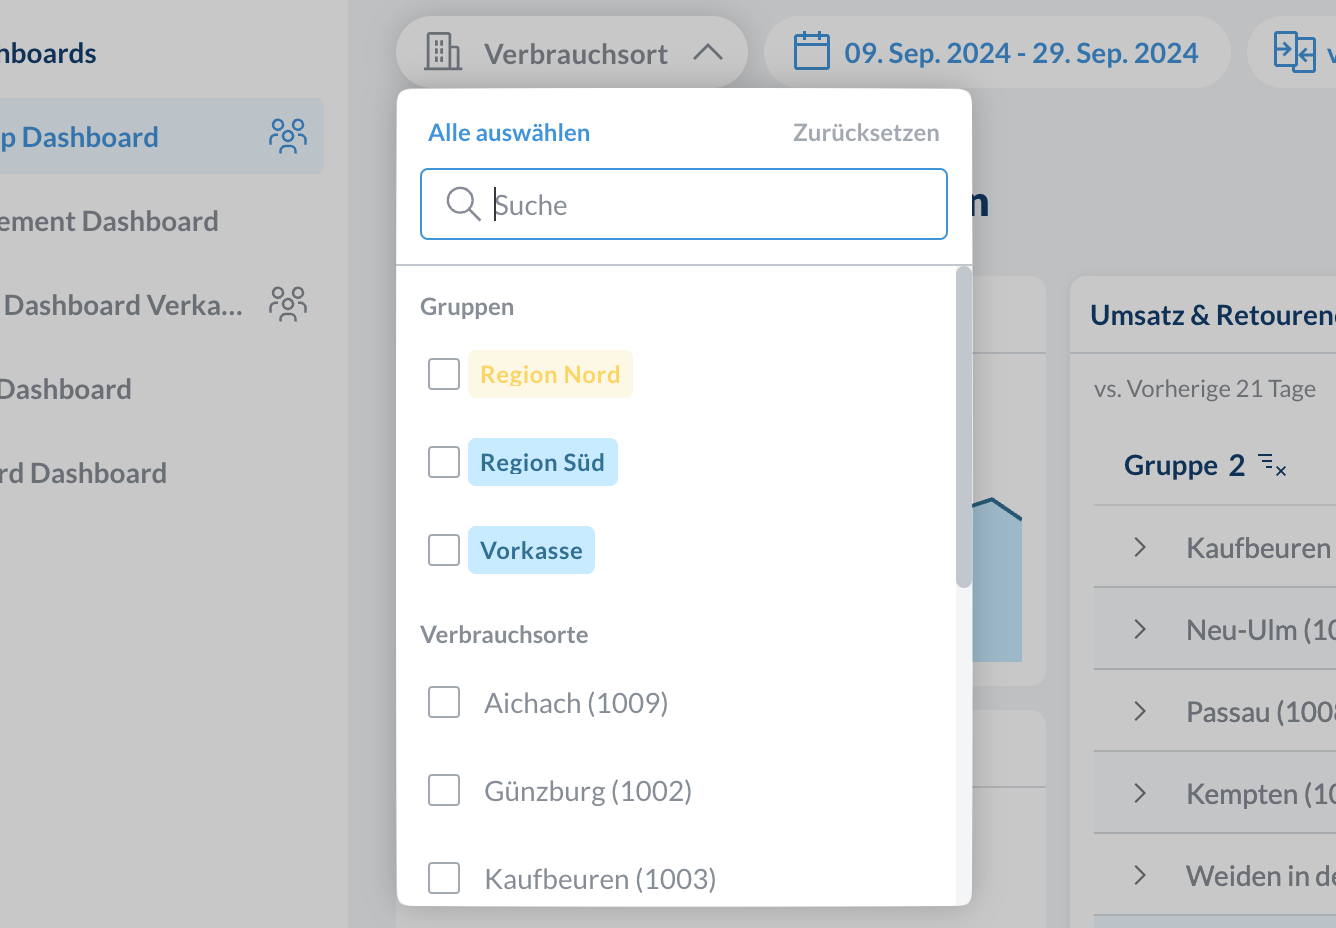
Note: Filters remember specific locations, not groups. If you update a group later, you’ll need to update your filters manually.
Date Filter
Analyze any time period
Date Filter
Analyze any time period
Custom Range: Pick exact dates or set rolling ranges that update automaticallyQuick Picks: Jump to common periods like 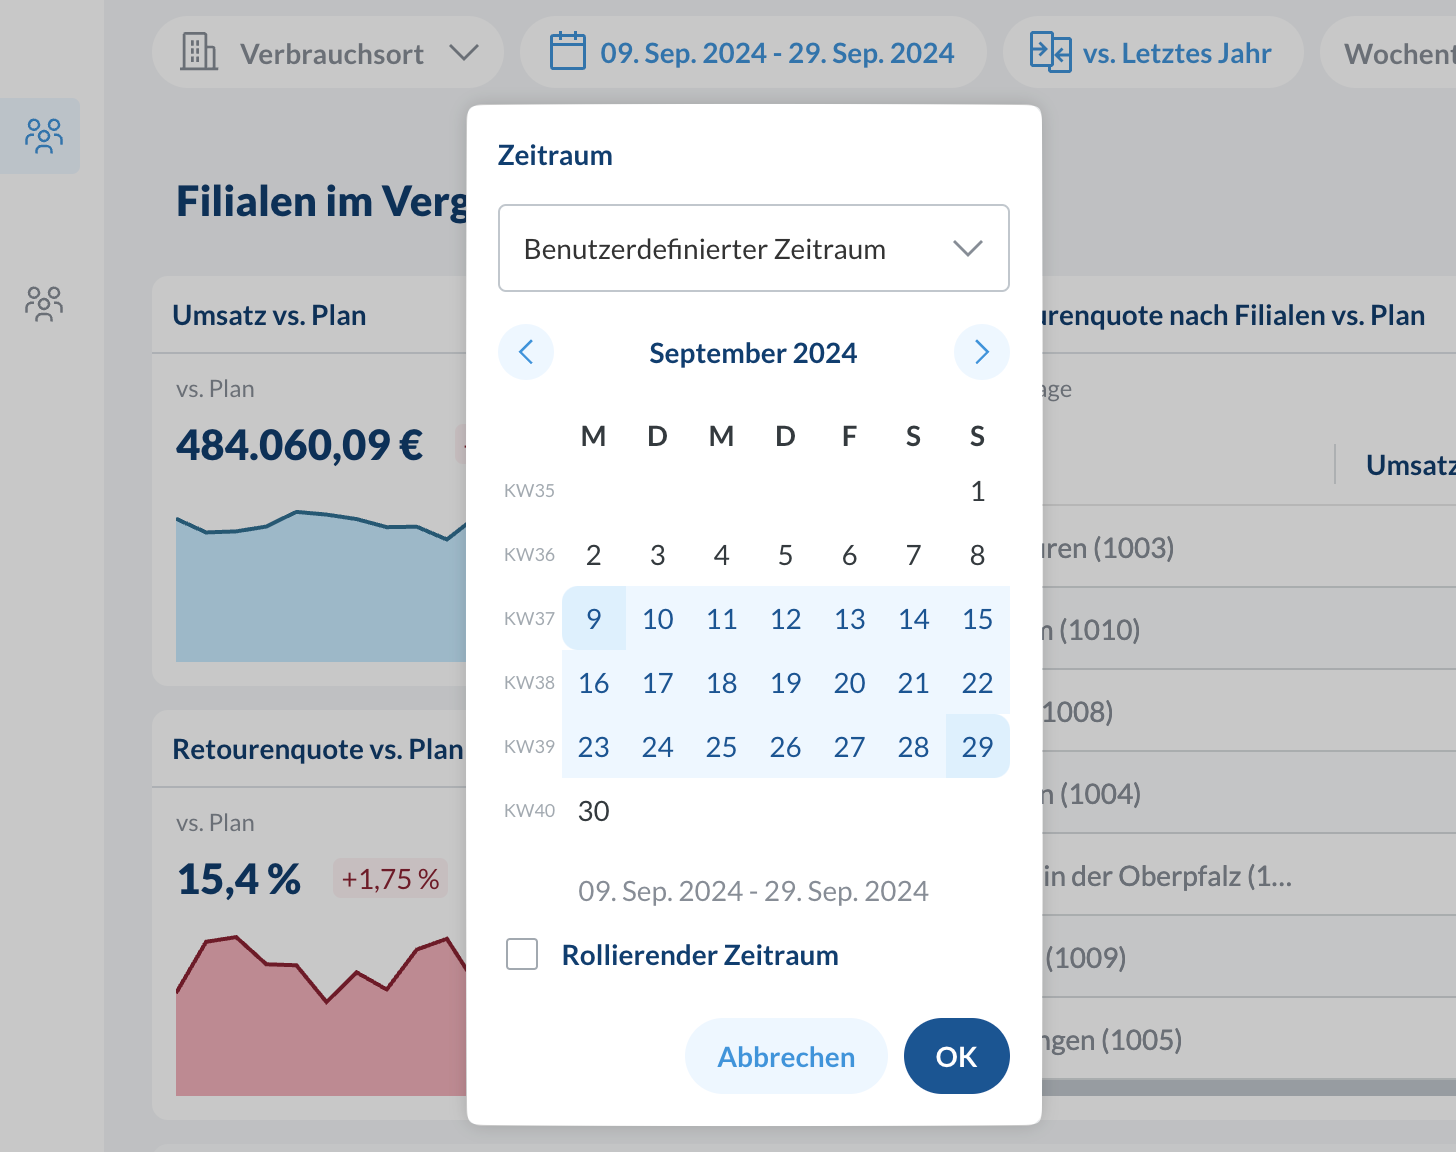
Today, This Week, or Year to DateWeekdays: Add weekday filters on top of your date rangeItem Filter
Focus on items and categories
Item Filter
Focus on items and categories
Item Groups: Categories from your ERP (e.g., “Bread”, “Beverages”)Items: Individual items.Item Tag: Group items managed in the Delicious Data item base data view.
As opposed to the location group filtering, this filter actually stores the selected tag, so updating the tag assignment in the item base data will automatically update the filter.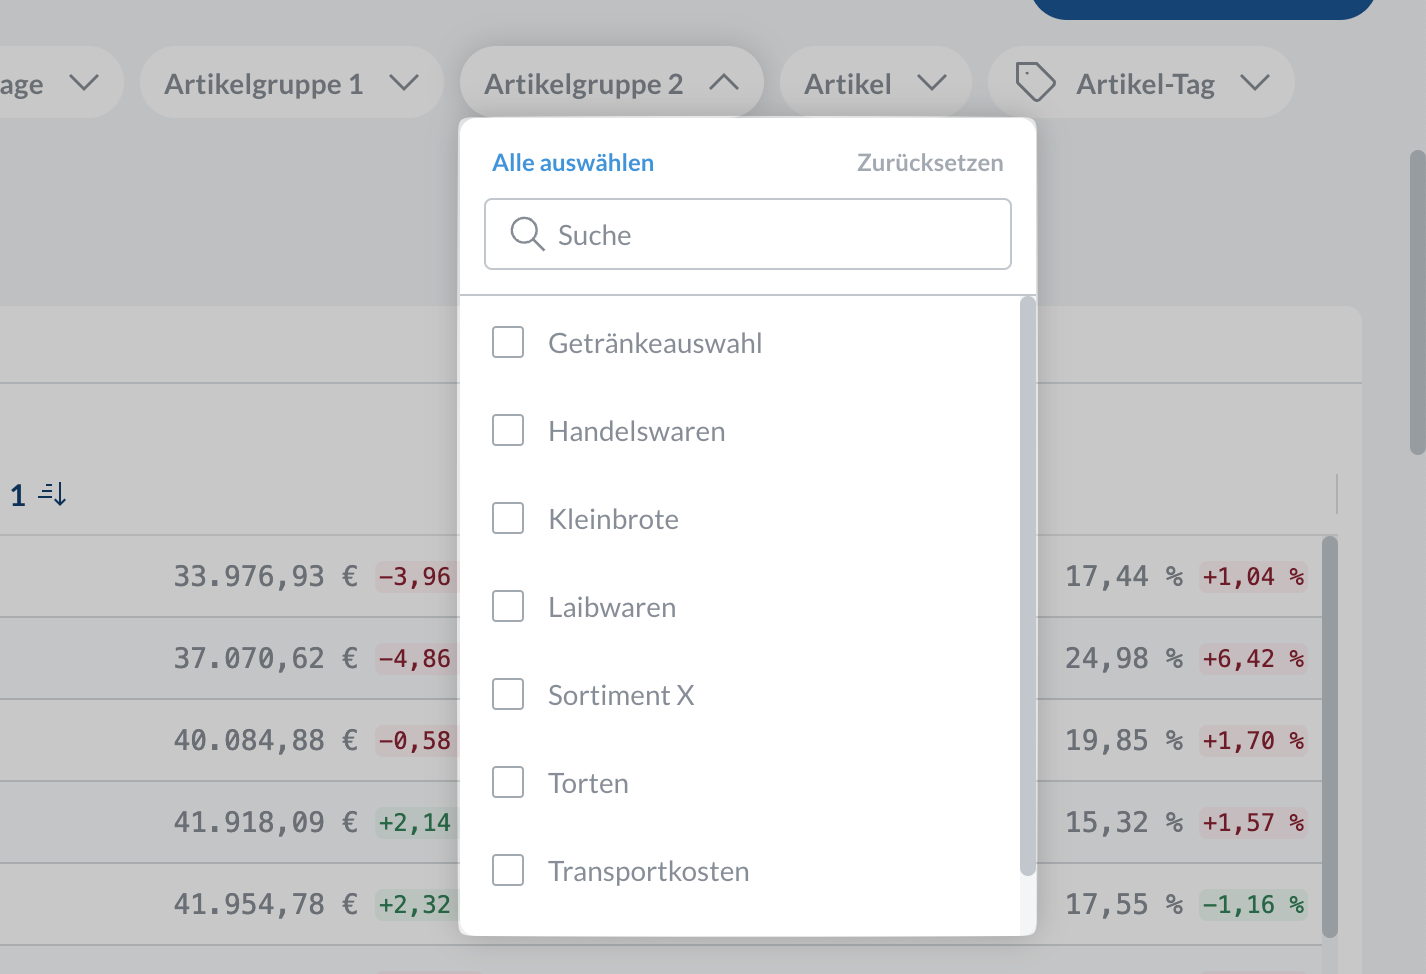
Report Filters
Override dashboard filters for individual reports to create powerful comparisons: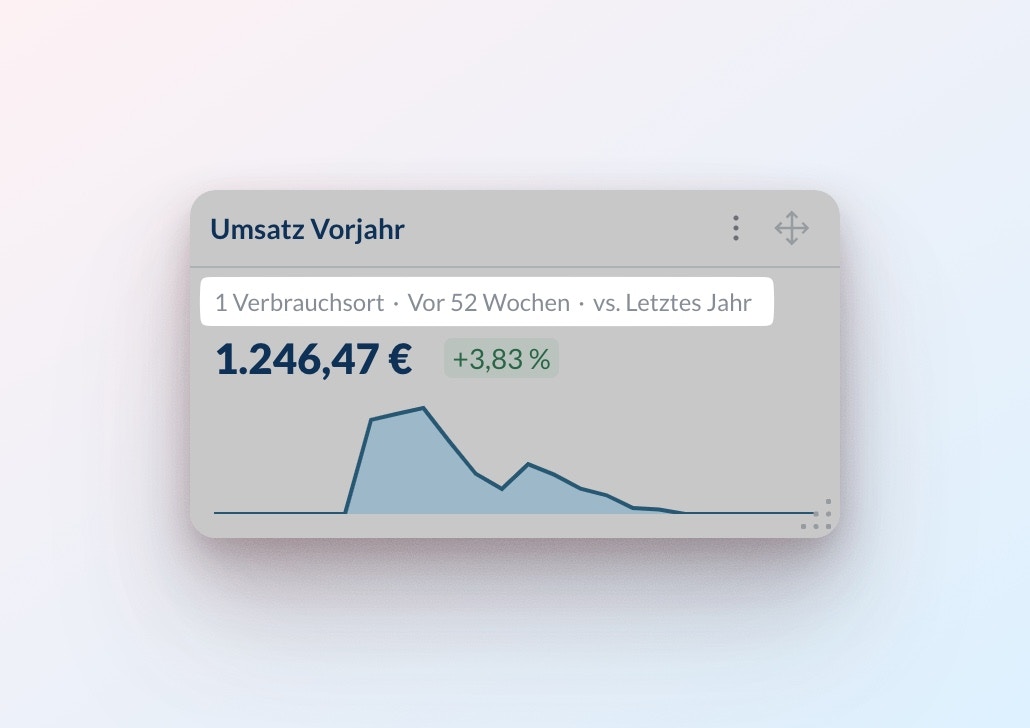
- Compare time periods: See
TodayvsLast 7 Days - Compare regions: Show
Northnext toSouth - Mix and match: Keep other dashboard filters while focusing on specific aspects
Automatic Comparisons
Compare current performance against various benchmarks:
Last Year
Analyze year-over-year growth
Last Year
Analyze year-over-year growth
- Compare with same period last year
- Choose
DateorMatching Weekdays
Previous Periods
Compare with recent timeframes
Previous Periods
Compare with recent timeframes
- Options:
Yesterday,Last Week,Previous X Days - Auto-updates (e.g.,
Today vs YesterdaybecomesThis Week vs Last Week)
Custom Date
Select any past date range
Custom Date
Select any past date range
- Pick historical baseline period
- Fixed or rolling start date
Target
Compare against predetermined targets
Target
Compare against predetermined targets
- Track progress against business goals
- Defined per location and date
Contact support to import target values
Select “No Comparison” to view raw data without comparative analysis
Share Dashboards
Sharing dashboards with your team is easy:To make sharing dashboards easy, each user automatically only sees data for their authorized locations only.
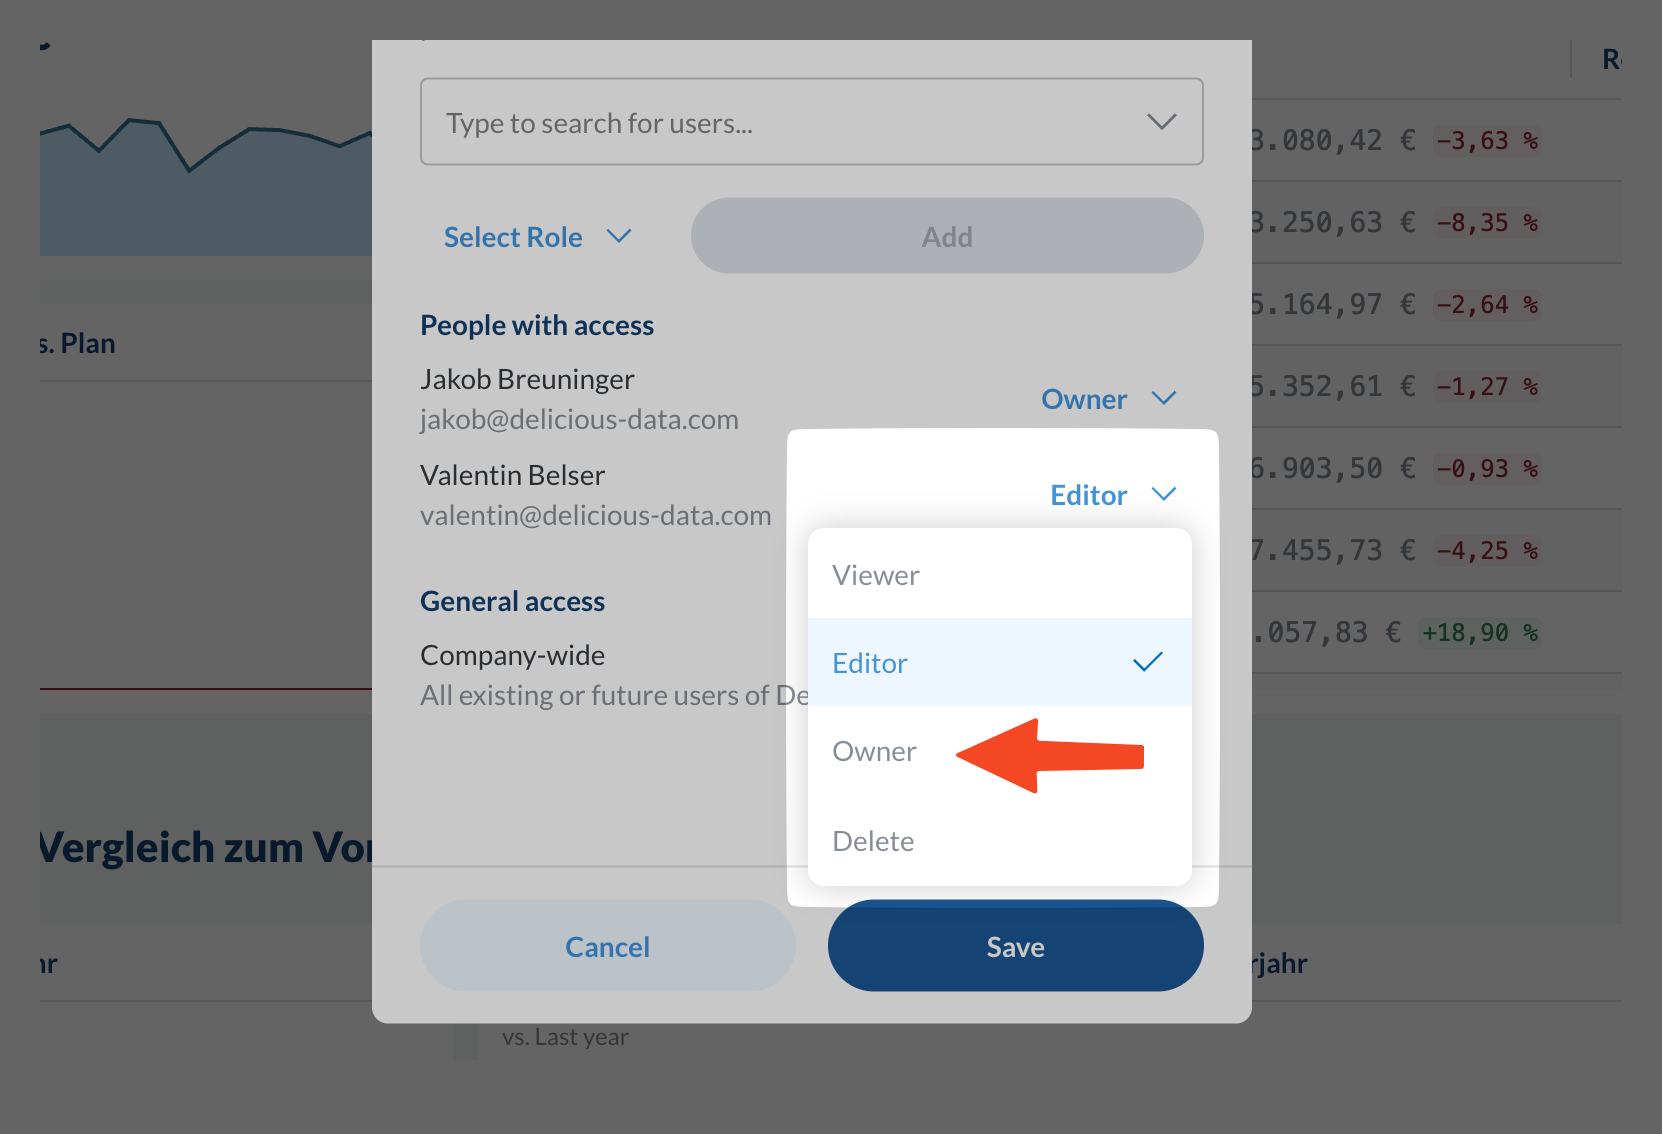
Share Access
Use the
Share button at the top of the dashboard to invite team members. You can add multiple team members at once or even share the dashboard with user groups you have previously added in the admin section.Assign Roles
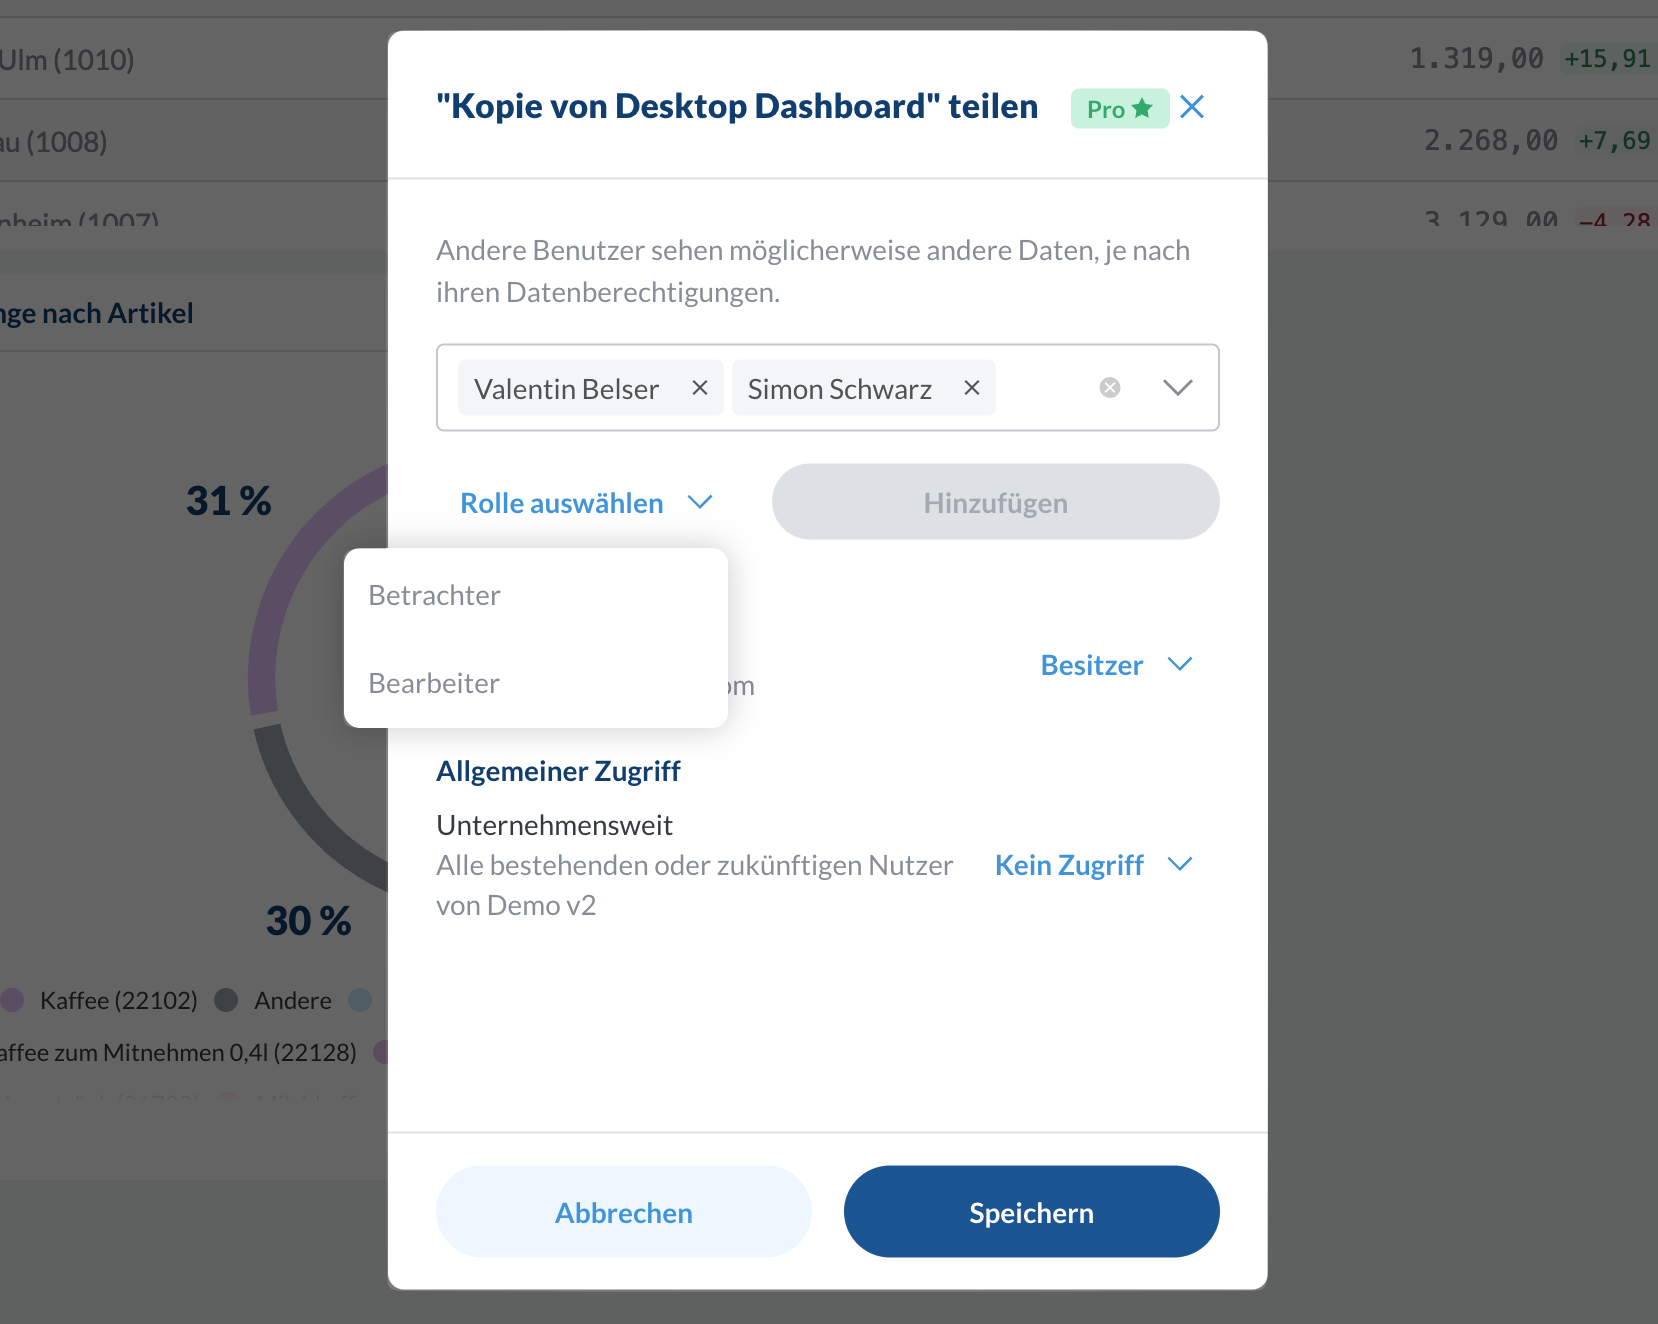
Viewer, Editor- Editors: Can update the dashboard for everyone else, but not share or delete it.
- Viewers: Can not update the dashboard for other users, but are allowed to add dashboard filters for themselves, which will automatically get reset to the shared state when they refresh the page.
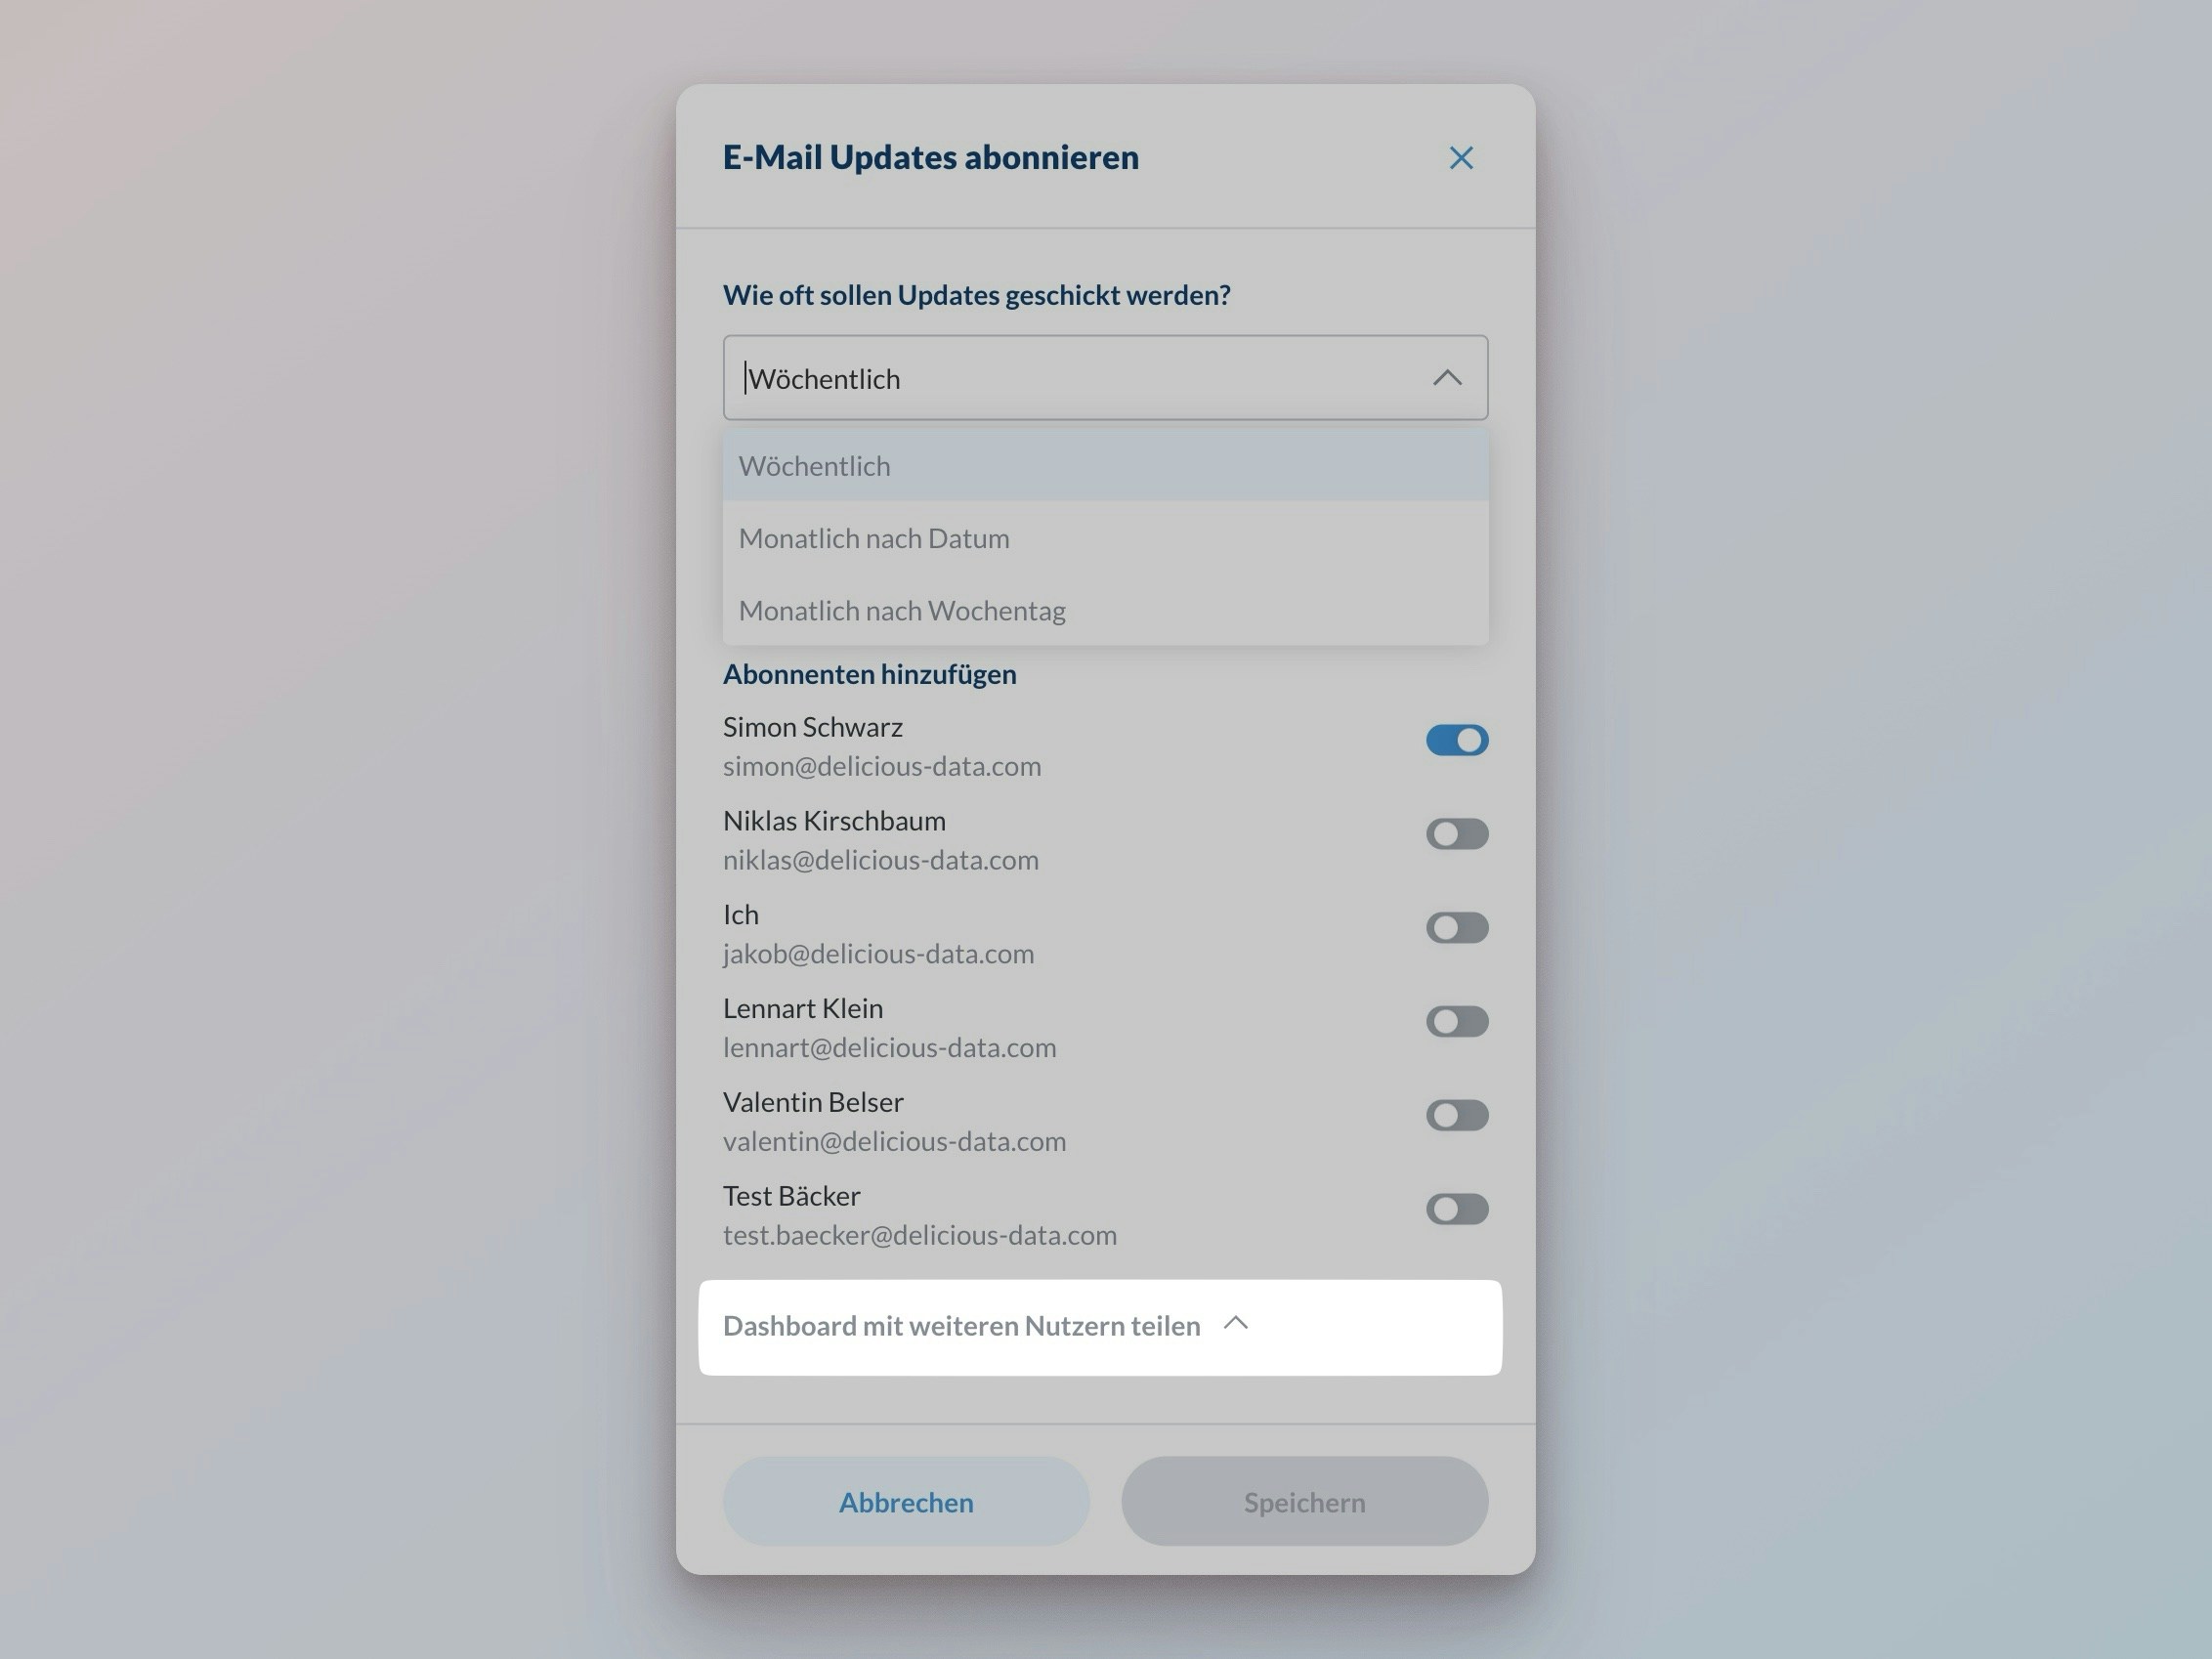
Email Subscriptions
Keep your team informed with automated dashboard updates:Dashboards with AI Insights enabled include an AI-generated summary of key findings in every email.
Configure Schedule
Select the perfect delivery timing for your team:
- Weekly: Choose specific weekdays and a time (e.g., Mon-Fri at 07:00)
- Monthly by date: Select key dates and a time(e.g., 1st and 15th of every month at 07:00)
- Monthly by weekday: Pick recurring patterns and a time (e.g., first and third Monday at 07:00)
AI Insights
Get automated analysis and actionable recommendations from your dashboard data:Access AI Analysis
Click the 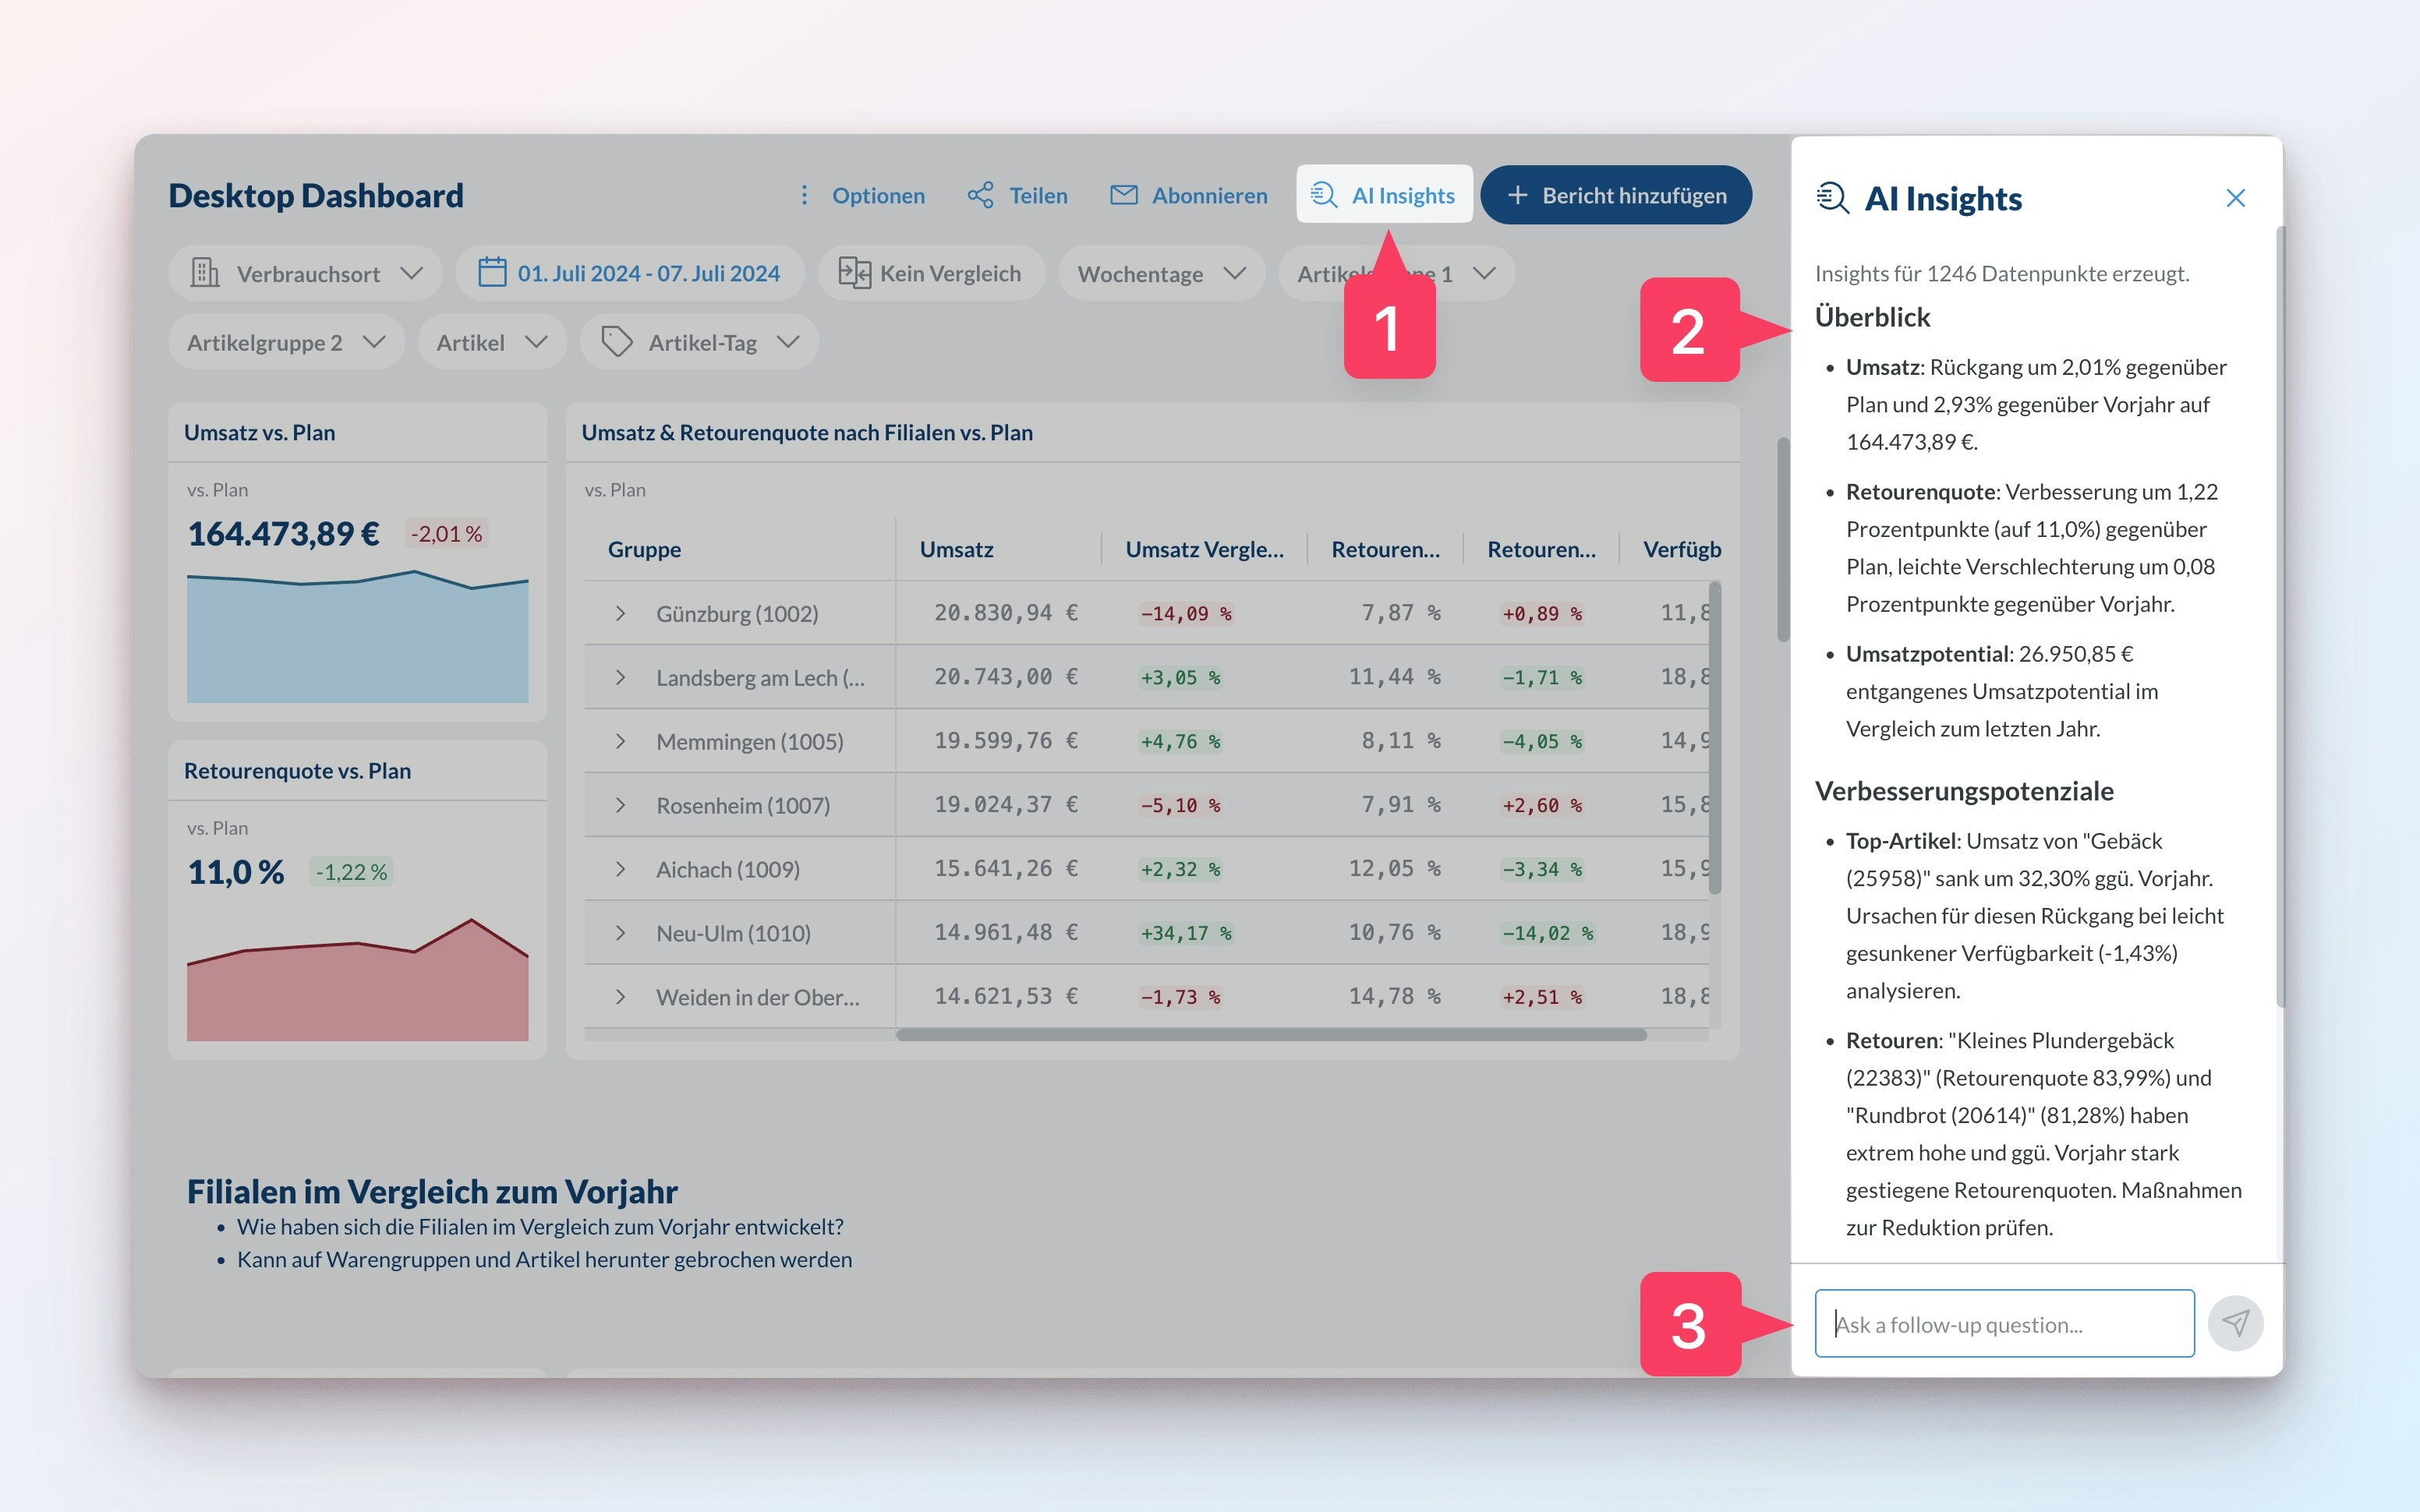
AI Insights button at the top of your dashboard to open the AI chat interface.
The AI automatically highlights the most important patterns and improvement opportunities in your data.AI Insights are also automatically included in your email subscriptions, providing your team with regular analysis without any manual effort.
Ask Follow-up Questions
Deepen your understanding by asking specific questions about your data:
- Request detailed explanations of trends
- Compare performance across different dimensions
- Ask for recommendations to improve specific metrics