
Welcome to Business Intelligence
Unlock the full potential of your business data with our powerful analytics platform. Whether you’re tracking sales performance, optimizing food waste, or identifying growth opportunities, our Business Intelligence tools provide the insights you need to make confident decisions.Real-time Analytics
Access up-to-the-minute data across all your business operations
Custom Dashboards
Build personalized views that focus on your most important metrics
AI-Powered Insights
Discover hidden patterns and opportunities with automated analysis
Mobile Optimized
Monitor your business from anywhere on any device
Your First 15 Minutes
Get up and running quickly with these essential steps:Access Your First Dashboard
Navigate to the Analyse section of the app. You’ll find pre-configured dashboards ready for immediate use.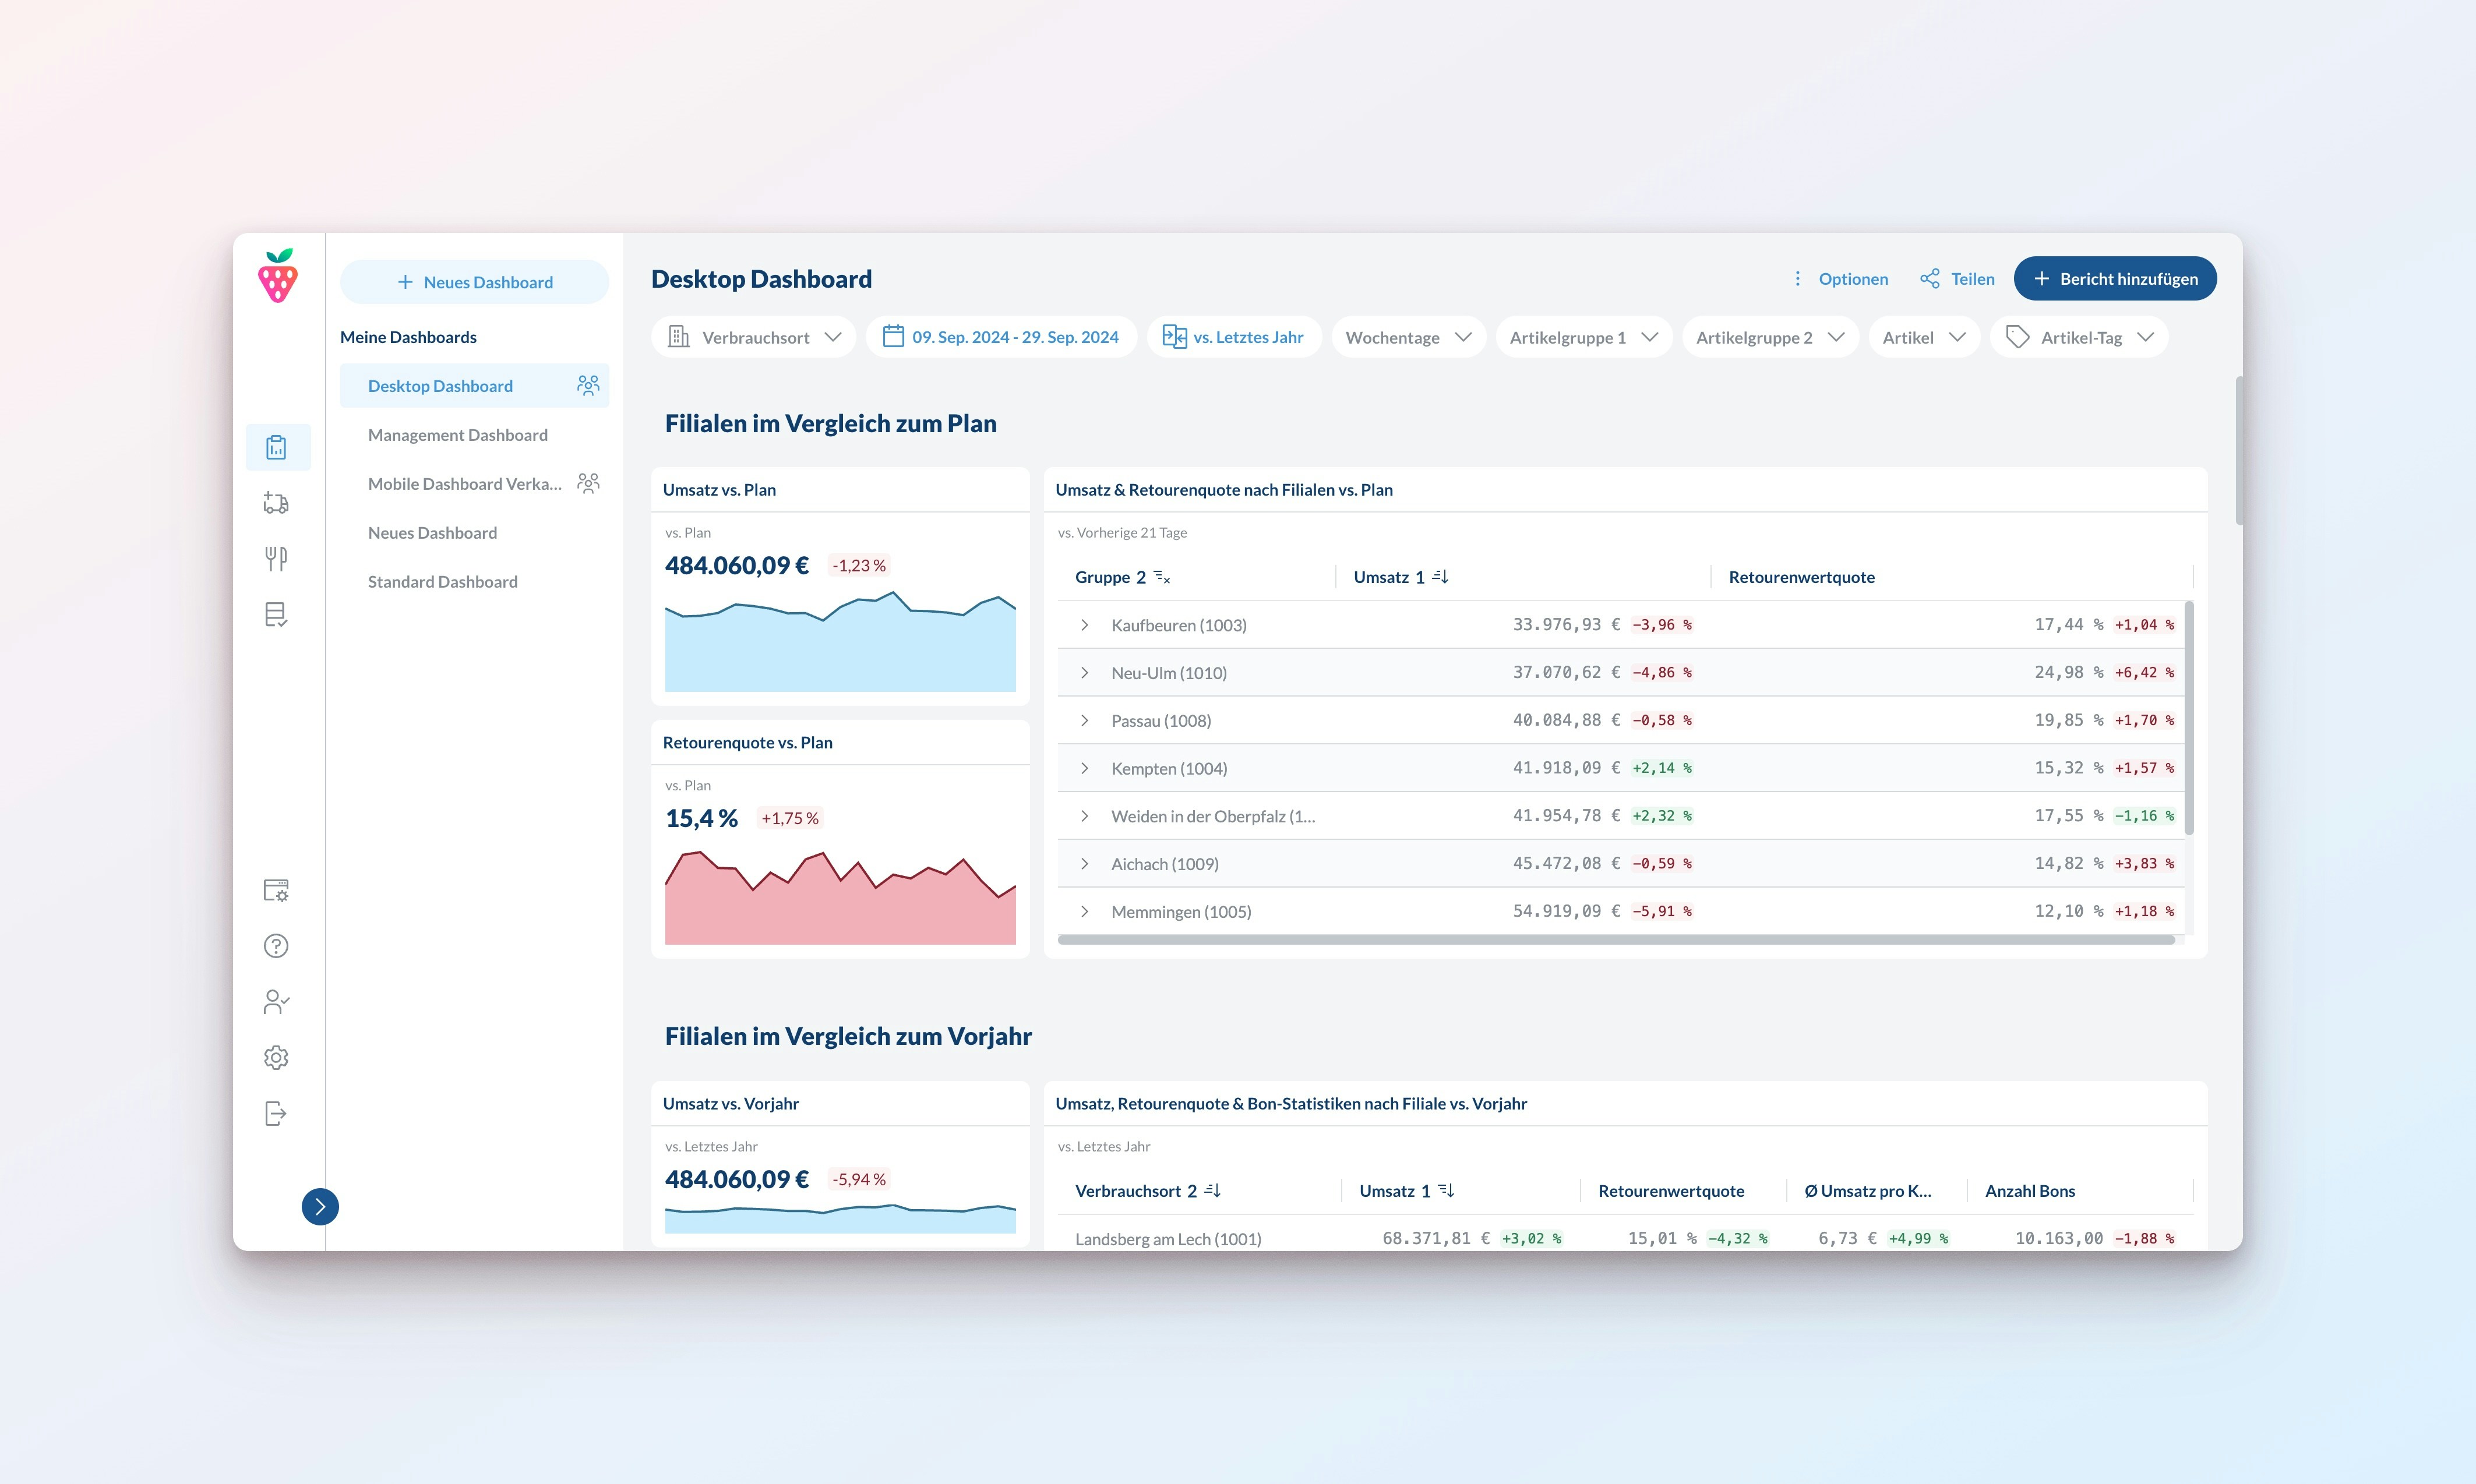
Explore Your Data
Start with our “Business Overview” dashboard to see your most critical metrics at a glance:
- Revenue and transaction trends
- Food waste and other sustainability metrics
- Key performance indicators with historical comparisons
Essential Features
Our Business Intelligence platform includes these key features:Dashboards
Your command center for business data
Dashboards
Your command center for business data
Create customized views of your business data with our flexible dashboard builder:
- Drag-and-drop interface for easy customization
- Mobile-responsive designs that work on any device
- Shareable layouts for team collaboration
Reports
Visualize your data effectively
Reports
Visualize your data effectively
Choose from a variety of visualization options to best represent your data:
- Line charts for trend analysis
- Bar charts for comparisons
- Pie charts for distribution analysis
- Tables for detailed data examination
Metrics
Track what matters most
Metrics
Track what matters most
Monitor the key performance indicators that drive your business:
- Pre-configured metrics for common business needs
- Historical comparisons and trend analysis
- Impact metrics like “Saved Meals”
AI Insights
Automated analysis and recommendations
AI Insights
Automated analysis and recommendations
Let our AI do the heavy lifting by automatically identifying:
- Unusual patterns or anomalies
- Growth opportunities
- Potential issues before they become problems
- Performance optimization recommendations
Next Steps
Ready to dive deeper? Here’s where to go next:Create Your First Custom Dashboard
Build a dashboard tailored to your specific business needs with our Dashboard Creation Guide.
Set Up Automated Reports
Configure Email Subscriptions to receive regular updates on your most important metrics.
Get Support
Have questions? Check our FAQs or contact our support team for personalized assistance.